A trusted platform for stock market education, offering in-depth insights into trading strategies, options trading, technical analysis, and investment planning. Our content is designed to simplify the market and guide you step by step. Start your journey today and take control of your financial future.
Frequently Asked Questions (Beginner Guide)
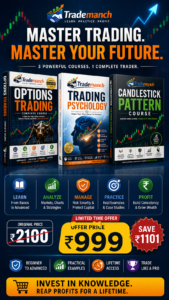
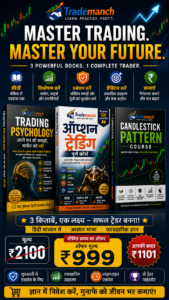
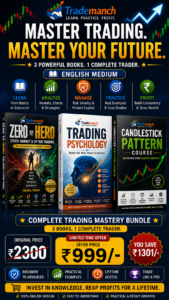
📊 1. What is the Stock Market?
💰 2. What is a Share?
📈 3. What is NIFTY and Sensex?
🏦 4. What is an IPO?
📉 5. What is Bull and Bear Market?
⚡ 6. What is Intraday Trading?
📊 7. What is Demat Account?
💹 8. What is Dividend?
📉 9. What is Risk in Stock Market?
🧠 10. How to Start Investing in Stock Market?
E-Books Pdf
Free Courses
Stock Market Trends (2025–26)
📊 1. Price Action Trading (No Indicators)
🧠 2. Trading Psychology & Mindset
📉 3. Risk Management Strategies
📈 4. Swing Trading Strategies
🧾 5. Fundamental Analysis for Beginners
💡 6. Best Indicators for Trading (RSI, MACD, Moving Average)
🏦 7. Best Stocks for Long-Term Investment (India)
📊 8. Nifty 50 & Sensex Explained (Beginner to Advanced)
⚡ 9. Intraday Trading Strategies That Work
📅 10. Best Time to Trade in Indian Stock Market
💼 11. How to Build a Profitable Trading Plan
🧮 12. Candlestick Patterns (Complete Guide)
💰 13. Passive Income from Stock Market
📉 14. Common Mistakes Beginners Make in Trading
📊 15. Backtesting Trading Strategies
💰 16. Cryptocurrency vs Stock Market
🌍 17. Global Market Impact (US Fed & Inflation)
💰 18. Budget & Policy Impact on Stock Market
⚡19. Algorithmic Trading (Algo Trading) – Complete Guide
🤖 20. AI in Stock Market
Candlestick Pattern
📊 1. Hammer – Strong bullish reversal after a downtrend; buyers reject lower prices.
📊 2. Shooting Star – Bearish reversal at the top; sellers overpower buyers after a rise.
📊 3. Bullish Engulfing – Big green candle engulfs red; strong buying momentum.
📊 4. Bearish Engulfing – Big red candle engulfs green; strong selling pressure
📊 5. Doji – Market indecision; trend may reverse or pause.
📊 6. Morning Star – 3-candle bullish reversal; signals trend change upward.
📊 7. Evening Star – 3-candle bearish reversal; signals trend turning downward.
📊 8. Hanging Man – Weakness after uptrend; possible bearish reversal.
📊 9. Piercing Line – Bullish recovery after sharp fall; buyers stepping in.
📊 10. Dark Cloud Cover – Bearish rejection near top; sellers gaining control.
📊 11. Inside Bar – Consolidation phase; breakout expected soon.
📊 12. Outside Bar – High volatility; signals strong move ahead.
📊 13. Pin Bar – Rejection candle; highlights strong support/resistance.
📊 14. Tweezer Top / Bottom – Double rejection; reversal confirmation.
📊 15. Three Outside Up / Down – Engulfing + confirmation; strong trend reversal.
📊 16. Three Inside Up / Down – Early reversal signal with confirmation.
📊 17. Gap Up / Gap Down – Sudden price jump; indicates strong sentiment.
📊 18. Rising Three Methods – Pause in uptrend before continuation.
📊 19. Falling Three Methods – Temporary pullback in downtrend.
📊 20. Bullish Mat Hold – Strong bullish continuation after consolidation.
📊 21. Tasuki Gap – Trend continuation with gap support.
📊 22. Separating Lines – Trend resumes after brief pause.
📊 23. Three Line Strike – Powerful continuation after correction.
📊 24. Abandoned Baby – Rare but strong reversal with gap isolation.
📊 25. Kicker – Sudden sentiment shift; explosive reversal.
📊 26. Three Black Crows – Strong bearish trend formation.
📊 27. Ladder Bottom – Gradual shift from bearish to bullish.
📊 28. Ladder Top – Slow distribution before fall.
📊 29. Breakaway – Trend reversal after strong breakout structure.
📊 30. Harami – Small candle inside big one; trend slowing down.
📊 31. Belt Hold – Strong single candle reversal signal.
📊 32. Matching High – Resistance confirmation at same level.
📊 33. Matching Low – Support confirmation at same level.
📊 34. Meeting Lines – Price rejection at equal close levels.
📊 35. On Neck – Weak bullish attempt in downtrend.
📊 36. In Neck – Slight bullish reaction but trend remains bearish.
📊 37. Spinning Top – Indecision with slight volatility.
📊 38. High Wave – Extreme indecision; high volatility market.
📊 39. Shaven Head – Strong bullish candle (no upper wick)
📊 40. Shaven Bottom – Strong bearish candle (no lower wick).
📊 41. Popgun – Inside + outside combo; breakout setup.
📊 42. Concealing Baby Swallow – Rare bullish reversal in downtrend.
📊 43. Homing Pigeon – Subtle bullish reversal pattern.
📊 44. Side by Side White Lines – Continuation with gap support.
📊 45. Stick Sandwich – Price support confirmed by equal closes.
📊 46. Unique Three River Bottom – Complex bullish reversal.
📊 47. Three Stars in the South – Slow but steady reversal signal.
📊 48. Advanced Block – Weakening bullish trend.
📊 49. Deliberation – Uptrend losing momentum.
📊 50. Identical Three Crows – Consistent bearish dominance.
Chart Patterns
📊 1. Head and Shoulders – Bearish reversal after uptrend
📊 2. Inverse Head and Shoulders – Bullish reversal after downtrend
📊 3. Double Top – Strong resistance → price falls
📊 4. Double Bottom – Strong support → price rises
📊 5. Triple Top – Multiple resistance → bearish signal
📊 6. Triple Bottom – Multiple support → bullish signal
📊 7. Ascending Triangle – Bullish continuation
📊 8. Descending Triangle – Bearish continuation
📊 9. Symmetrical Triangle – Breakout in either direction
📊10. Flag & Pennant – Strong trend continuation
📊 11.Cup and Handle – Bullish continuation; rounded bottom followed by breakout
📊 12. Rounding Bottom – Long-term bullish reversal pattern
📊 13. Rounding Top – Slow bearish reversal after uptrend
📊 14. Wedge (Rising Wedge) – Bearish signal; price rising but weakening
📊 15. Wedge (Falling Wedge) – Bullish signal; price falling but losing momentum
Indicators
📊 1. RSI (Relative Strength Index)
🧠 2. MACD (Moving Average Convergence Divergence)
📉 3. Supertrend Indicator
📈 4. VWAP (Volume Weighted Average Price)
🧾 5. Bollinger Bands
💡 6. EMA (Exponential Moving Average)
🏦 7. SMA (Simple Moving Average)
📊 8. Volume Profile
⚡ 9. Stochastic Oscillator
📅 10. Ichimoku Cloud
💼 11. ADX (Average Directional Index)
🧮 12. Fibonacci Retracement
💰 13. Pivot Points
📉 14. ATR (Average True Range)
📊 15. Parabolic SAR
Recent Posts
Testimonial
"TradeManch provides well-structured and easy-to-understand eBooks for anyone starting their stock market journey. The content is explained in simple language with practical examples, making complex trading concepts easy to learn. Highly recommended for beginners."
Sandeep Gupta
⭐⭐⭐⭐⭐
"I found the eBooks on TradeManch extremely informative and practical. Topics such as technical analysis, risk management, and trading psychology are covered in detail. The lessons are clear, actionable, and useful for real market conditions."
Amit Verma
⭐⭐⭐⭐⭐
"TradeManch offers a comprehensive collection of trading and investing eBooks that help traders build a strong foundation. The content is organized module-wise, allowing learners to progress step by step from beginner to advanced levels."
Priya Mehta
⭐⭐⭐⭐⭐
"TradeManch offers a comprehensive collection of trading and investing eBooks that help traders build a strong foundation. The content is organized module-wise, allowing learners to progress step by step from beginner to advanced levels."
Priya Mehta
⭐⭐⭐⭐⭐
"The quality of educational material available on TradeManch is impressive. Each eBook is professionally designed, easy to read, and packed with valuable insights. It is a great platform for anyone looking to improve their trading skills."
Sandeep Gupta
⭐⭐⭐⭐⭐
"TradeManch has become one of my favorite learning platforms for stock market education. The eBooks provide practical strategies, market knowledge, and trading discipline techniques that can help traders avoid common mistakes and trade with confidence."
Neha Kapoor
⭐⭐⭐⭐⭐
Why Choose TradeManch?
Simple and easy-to-understand content
Designed for beginners and serious learners
Focus on practical knowledge, not just theory
Regular updates and relevant market insights
Learn at your own pace


