The Exponential Moving Average (EMA) is one of the most popular technical indicators used by traders and investors worldwide. It helps identify:
- Market trends
- Buy and sell signals
- Support and resistance levels
- Trend reversals
- Momentum shifts
Unlike the Simple Moving Average (SMA), EMA gives more importance to recent price data, making it more responsive to market changes.
EMA is widely used in:
- Stock market trading
- Intraday trading
- Swing trading
- Forex trading
- Cryptocurrency trading
- Options trading
This complete guide explains everything about EMA, including formulas, calculations, strategies, advantages, limitations, and practical trading applications.
What Is EMA?
EMA stands for:
- Exponential Moving Average
It is a trend-following indicator that calculates the average price of an asset while giving more weight to recent prices.
This makes EMA react faster than SMA when market conditions change.
Simple Definition of EMA
EMA is a moving average that gives greater importance to recent price movements, helping traders identify trends more quickly.
Why EMA Is Important
EMA helps traders:
- Identify trends early
- Generate buy and sell signals
- Spot trend reversals
- Reduce market noise
- Improve trade timing
Because of its responsiveness, EMA is especially popular among intraday and swing traders.
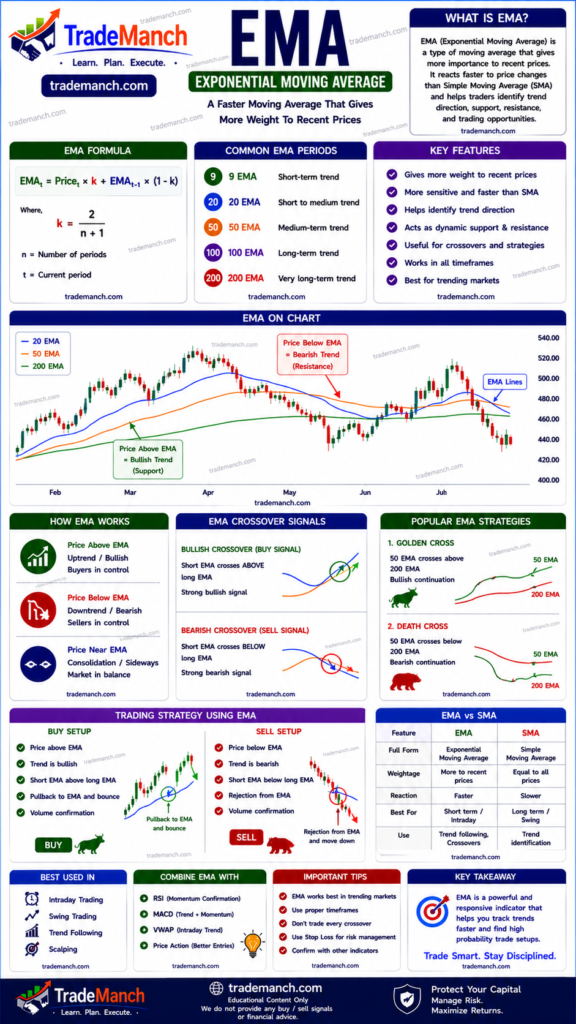
EMA Formula
The EMA calculation uses a multiplier:
Multiplier=n+12
Where:
- n = Number of periods
The EMA formula is:
EMA=(Current Price×Multiplier)+(Previous EMA×(1−Multiplier))
Most trading platforms calculate EMA automatically.
How EMA Works
EMA continuously updates as new prices arrive.
Recent prices receive:
- Higher weighting
Older prices receive:
- Lower weighting
This makes EMA react more quickly to price changes.
Popular EMA Periods
Different traders use different EMA settings.
| EMA Period | Usage |
|---|---|
| 9 EMA | Scalping & Intraday |
| 20 EMA | Short-Term Trend |
| 50 EMA | Swing Trading |
| 100 EMA | Medium-Term Trend |
| 200 EMA | Long-Term Trend |
Understanding EMA Signals
Price Above EMA
When price trades above EMA:
- Bullish trend
- Buyers dominate
Possible interpretation:
- Uptrend
Price Below EMA
When price trades below EMA:
- Bearish trend
- Sellers dominate
Possible interpretation:
- Downtrend
EMA as Dynamic Support
In a strong uptrend:
- Price often bounces from EMA
EMA acts as:
- Dynamic support
EMA as Dynamic Resistance
In a downtrend:
- Price often rejects near EMA
EMA acts as:
- Dynamic resistance
EMA Trading Strategies
1. Single EMA Strategy
Buy Setup
- Price crosses above EMA
- Bullish momentum appears
Possible signal:
- Uptrend beginning
Sell Setup
- Price crosses below EMA
- Bearish momentum appears
Possible signal:
- Downtrend beginning
2. EMA Crossover Strategy
One of the most popular EMA strategies.
Bullish Crossover
Occurs when:
- Short-term EMA crosses above long-term EMA
Example:
9 EMA>21 EMA
Possible signal:
- Bullish momentum
Bearish Crossover
Occurs when:
- Short-term EMA crosses below long-term EMA
Example:
9 EMA<21 EMA
Possible signal:
- Bearish momentum
3. 20 EMA Pullback Strategy
A popular trend-following strategy.
Buy Example
- Strong uptrend
- Price pulls back to 20 EMA
- Bullish candle appears
Possible continuation setup.
4. 50 EMA Trend Strategy
Many professional traders use:
- 50 EMA
to identify:
- Overall trend direction
Bullish Market
- Price above 50 EMA
Bearish Market
- Price below 50 EMA
5. 200 EMA Strategy
The 200 EMA is one of the most respected indicators in financial markets.
Price Above 200 EMA
Indicates:
- Long-term bullish trend
Price Below 200 EMA
Indicates:
- Long-term bearish trend
EMA in Intraday Trading
Intraday traders commonly use:
- 9 EMA
- 20 EMA
Popular charts:
- 5-minute
- 15-minute
EMA helps identify:
- Momentum
- Trend direction
- Entry opportunities
EMA in Swing Trading
Swing traders often use:
- 20 EMA
- 50 EMA
to identify:
- Medium-term trends
EMA in Long-Term Investing
Long-term investors use:
- 100 EMA
- 200 EMA
to identify:
- Major market trends
EMA in Cryptocurrency Trading
EMA is widely used on:
- Bitcoin
- Ethereum
because crypto markets react quickly to momentum changes.
EMA in Indian Stock Market
Popular stocks for EMA analysis:
- Reliance Industries
- Infosys
- HDFC Bank
These stocks often respect:
- 20 EMA
- 50 EMA
- 200 EMA
Advantages of EMA
Faster Than SMA
EMA reacts quickly to market changes.
Better for Short-Term Trading
Popular among intraday traders.
Easy to Understand
Suitable for beginners.
Works Across Markets
Useful in:
- Stocks
- Forex
- Crypto
- Commodities
Limitations of EMA
More False Signals
Because EMA reacts quickly:
- Whipsaws may occur
Lagging Indicator
Still based on historical data.
Weak in Sideways Markets
Can generate frequent false crossovers.
Common Beginner Mistakes
Trading Every EMA Crossover
Not every crossover leads to a trend.
Ignoring Higher Timeframes
Always confirm the larger trend.
Using EMA Alone
Combine EMA with:
- RSI
- MACD
- Volume Analysis
Overusing Multiple EMAs
Too many EMAs can create confusion.
Best Indicators to Combine With EMA
Popular combinations:
- EMA + RSI
- EMA + MACD
- EMA + Volume Analysis
- EMA + Bollinger Bands
- EMA + Supertrend
EMA + RSI Strategy
Buy Example
- Price above 50 EMA
- RSI above 50
Possible bullish continuation.
EMA + MACD Strategy
Buy Example
- Price above 200 EMA
- MACD bullish crossover
Strong trend confirmation.
EMA vs SMA
| EMA | SMA |
|---|---|
| Gives more weight to recent prices | Equal weighting |
| Faster response | Slower response |
| Better for short-term trading | Better for long-term analysis |
EMA vs VWAP
| EMA | VWAP |
|---|---|
| Price-based indicator | Price + Volume based |
| Works on all timeframes | Mostly intraday |
| Trend analysis | Institutional analysis |
Best Timeframes for EMA
| Trading Style | Timeframe |
|---|---|
| Scalping | 1-min / 5-min |
| Intraday Trading | 5-min / 15-min |
| Swing Trading | 1H / Daily |
| Positional Trading | Daily / Weekly |
Risk Management While Using EMA
Always use:
- Stop loss
- Position sizing
- Risk-reward ratio
Example of Risk-Reward Ratio
Suppose:
- Risk = ₹20
- Target = ₹60
Risk-reward ratio:
2060=3:1
Can EMA Guarantee Profits?
No.
EMA helps traders:
- Identify trends
- Improve timing
- Analyze market direction
It cannot guarantee profitable trades.
Successful trading still requires:
- Discipline
- Risk management
- Patience
How Beginners Should Learn EMA
Step 1: Understand Trend Basics
Learn:
- Uptrends
- Downtrends
- Consolidation
Step 2: Practice EMA Analysis
Study historical chart behavior.
Step 3: Learn EMA Crossovers
Observe bullish and bearish crossover setups.
Step 4: Combine With Other Indicators
Use confirmation before entering trades.
The Exponential Moving Average (EMA) is one of the most powerful and widely used trend-following indicators. Its ability to react quickly to price changes makes it especially useful for intraday and swing traders.
When combined with:
- RSI
- MACD
- Volume Analysis
- Price Action
EMA can significantly improve market analysis and trading decisions.
Whether you are a beginner or an experienced trader, mastering EMA can help you better understand market trends and improve your overall trading strategy.
Frequently Asked Questions (FAQs)
1. What is EMA in trading?
EMA stands for Exponential Moving Average and gives more weight to recent prices.
2. Is EMA better than SMA?
EMA reacts faster, while SMA is smoother and slower.
3. What is the most popular EMA setting?
20 EMA, 50 EMA, and 200 EMA are widely used.
4. Is EMA good for intraday trading?
Yes, EMA is one of the most popular intraday indicators.
5. What does price above EMA mean?
It usually indicates a bullish trend.
6. What does price below EMA mean?
It usually indicates a bearish trend.
7. What is an EMA crossover?
It occurs when one EMA crosses another EMA.
8. Which indicators work best with EMA?
RSI, MACD, Bollinger Bands, and Volume Analysis.
9. Can EMA be used in crypto trading?
Yes, it is widely used in cryptocurrency markets.
10. Can EMA guarantee profits?
No, it improves analysis but cannot guarantee successful trades.