🔍 What is the On Neck Pattern?
The On Neck candlestick pattern is a bearish continuation pattern that appears during a downtrend. It signals a weak bullish recovery attempt that fails to reverse the bearish trend.
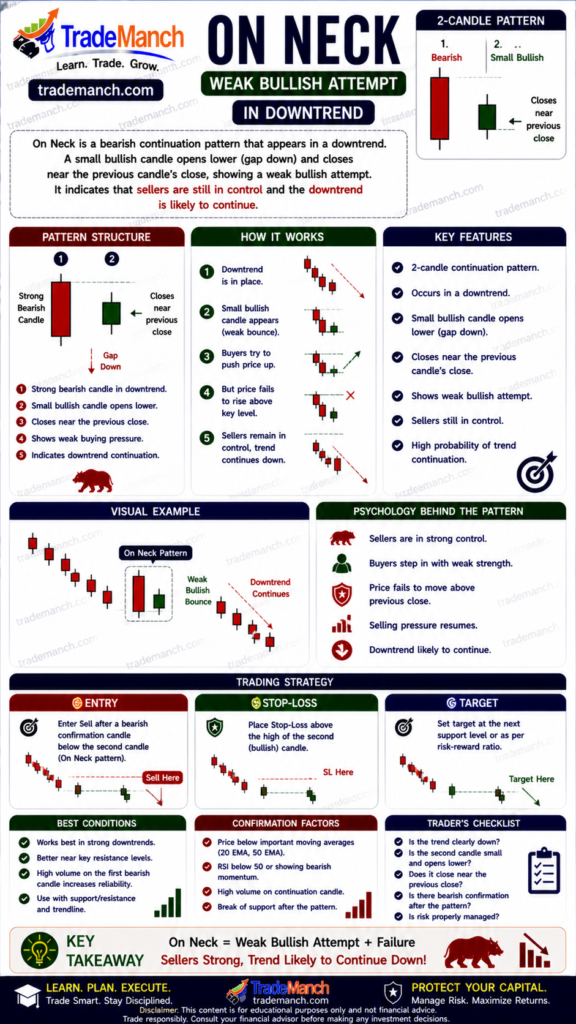
👉 The pattern suggests sellers still remain in control of the market.
📈 Structure of the On Neck Pattern
The pattern usually consists of two candles:
- 🔴 First Candle
A strong bearish candle continuing the downtrend. - 🟢 Second Candle
A small bullish candle that opens lower but closes near the previous candle’s low.
👉 The bullish candle fails to recover significantly, confirming bearish weakness.
💡 Psychology Behind the Pattern
The On Neck pattern reflects failed buyer recovery:
- Sellers push price sharply lower
- Buyers attempt a small rebound
- Recovery remains weak and cannot break resistance
👉 This indicates bearish momentum is still dominant.
✅ How to Trade the On Neck Pattern
🔹 Step-by-Step Strategy:
- Confirm Existing Downtrend
Pattern works best in strong bearish markets. - Identify Weak Bullish Recovery
Look for the small bullish candle closing near the prior low. - Wait for Bearish Confirmation
Additional bearish candle strengthens continuation signal. - Entry Point
Sell below the low of the bullish candle. - Stop Loss
Place above the bullish candle high. - Target
Use support levels or trend continuation targets.
⚠️ Common Mistakes to Avoid
- ❌ Confusing with reversal patterns
- ❌ Trading in sideways markets
- ❌ Ignoring trend strength
- ❌ Entering before bearish confirmation
🔗 On Neck vs In Neck Pattern
| Pattern | Bullish Recovery | Signal Strength |
|---|---|---|
| On Neck | Very weak | Strong bearish continuation |
| In Neck | Slightly stronger | Moderate bearish continuation |
👉 On Neck shows weaker buyer strength compared to In Neck.
🚀 Pro Tips for Better Accuracy
- Combine with trendline analysis
- Use moving averages for confirmation
- Watch for volume increase on bearish candles
- Trade with overall market trend
The On Neck pattern is a bearish continuation signal showing that buyers attempted a recovery but failed to reverse the downtrend.
👉 Traders often use it to identify opportunities to continue trading with the dominant bearish momentum.