
Fibonacci Retracement is one of the most powerful and widely used tools in technical analysis. Traders use Fibonacci levels to identify:
- Potential support levels
- Potential resistance levels
- Pullback opportunities
- Trend continuation zones
- Profit targets
- Reversal areas
Fibonacci Retracement is popular among:
- Intraday traders
- Swing traders
- Forex traders
- Cryptocurrency traders
- Professional investors
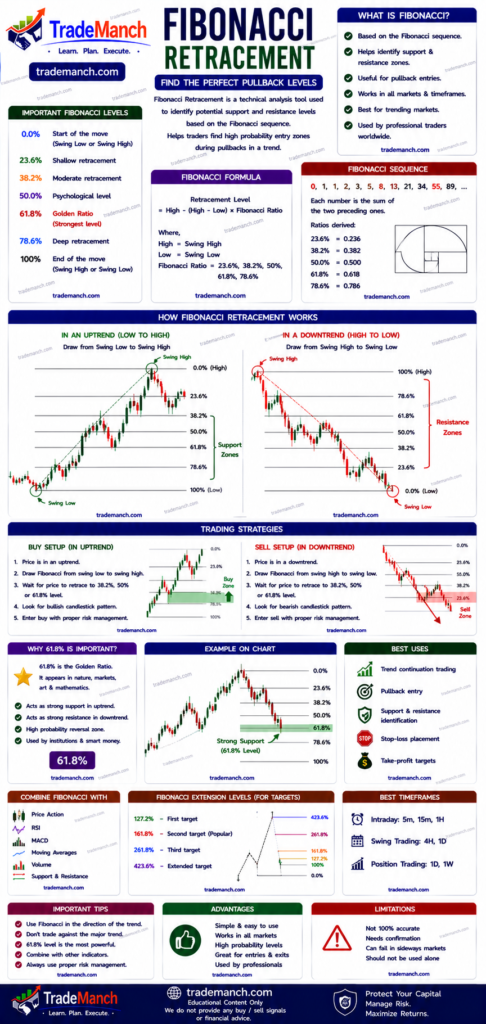
This complete beginner-friendly guide explains everything about Fibonacci Retracement, including its formula, key levels, trading strategies, advantages, limitations, and practical applications.
What Is Fibonacci Retracement?
Fibonacci Retracement is a technical analysis tool that uses mathematical ratios derived from the Fibonacci sequence to identify possible support and resistance levels.
Traders use Fibonacci levels to find areas where price may:
- Pause
- Reverse
- Continue its trend
Simple Definition of Fibonacci Retracement
Fibonacci Retracement is a charting tool used to identify potential price pullback levels during an uptrend or downtrend.
What Is the Fibonacci Sequence?
The Fibonacci Sequence is:
1, 1, 2, 3, 5, 8, 13, 21, 34, 55, 89…
Each number is the sum of the previous two numbers.
This sequence was popularized by:
- Leonardo Fibonacci
Why Fibonacci Is Important in Trading
Many traders believe markets often retrace a predictable portion of a move before continuing in the original direction.
Fibonacci levels help identify:
- Pullback zones
- Entry opportunities
- Exit opportunities
- Market structure
Key Fibonacci Retracement Levels
The most important Fibonacci levels are:
| Level | Percentage |
|---|---|
| 23.6% | Minor Retracement |
| 38.2% | Moderate Retracement |
| 50.0% | Psychological Level |
| 61.8% | Golden Ratio |
| 78.6% | Deep Retracement |
The Golden Ratio
The most important Fibonacci level is:
61.8%
This level is called:
- Golden Ratio
Many traders consider it the strongest support and resistance zone.
How Fibonacci Retracement Works
The tool is applied between:
- Swing High
- Swing Low
The platform automatically calculates retracement levels.
Fibonacci in an Uptrend
In an uptrend:
- Draw Fibonacci from Swing Low to Swing High
Retracement levels become potential:
- Support zones
Fibonacci in a Downtrend
In a downtrend:
- Draw Fibonacci from Swing High to Swing Low
Retracement levels become potential:
- Resistance zones
Understanding Major Fibonacci Levels
23.6% Level
Represents:
- Very shallow pullback
Indicates:
- Strong trend continuation
38.2% Level
Represents:
- Moderate correction
Common in healthy trends.
50% Level
Although not officially a Fibonacci ratio:
- Widely respected by traders
Often acts as:
- Major support
- Major resistance
61.8% Level
Most important Fibonacci level.
Known as:
- Golden Ratio
Often used by professional traders for entries.
78.6% Level
Represents:
- Deep correction
Price may reverse or invalidate trend.
Example of Fibonacci Retracement
Suppose:
- Swing Low = ₹100
- Swing High = ₹200
Price move:
200−100=100
Total move = ₹100
50% Retracement
200−(100×0.50)=150
Potential support = ₹150
61.8% Retracement
200−(100×0.618)=138.2
Potential support ≈ ₹138.2
Fibonacci Retracement Trading Strategies
1. Trend Pullback Strategy
Most popular Fibonacci strategy.
Buy Setup
- Uptrend exists
- Price retraces to 38.2%, 50%, or 61.8%
- Bullish confirmation candle appears
Possible trend continuation.
Sell Setup
- Downtrend exists
- Price retraces upward
- Bearish confirmation appears
Possible trend continuation downward.
2. Fibonacci + Support and Resistance
When Fibonacci levels align with:
- Historical support
- Historical resistance
The level becomes stronger.
3. Fibonacci + RSI Strategy
Popular combination:
- Fibonacci identifies pullback level
- RSI confirms momentum
Buy Example
- Price reaches 61.8%
- RSI below 40 and rising
- Bullish candlestick appears
Possible buy opportunity.
4. Fibonacci + MACD Strategy
Combination:
- Fibonacci level provides entry zone
- MACD crossover confirms momentum
Fibonacci Extension Levels
Besides retracement, traders use:
- Fibonacci Extensions
for profit targets.
Common levels:
- 127.2%
- 161.8%
- 261.8%
Fibonacci Extension Formula
Popular target:
161.8%
Many traders use this as:
- Trend continuation target
Fibonacci in Intraday Trading
Intraday traders use Fibonacci for:
- Pullback entries
- Scalping
- Breakout retests
Popular charts:
- 5-minute
- 15-minute
Fibonacci in Swing Trading
Swing traders frequently use:
- Daily chart
- 4-hour chart
to identify:
- High-probability entry zones
Fibonacci in Forex Trading
Fibonacci is extremely popular in forex because:
- Markets often respect retracement levels
Major currency pairs frequently react near:
- 38.2%
- 50%
- 61.8%
Fibonacci in Cryptocurrency Trading
Crypto traders use Fibonacci on:
- Bitcoin
- Ethereum
because crypto markets often exhibit strong retracements.
Fibonacci in Indian Stock Market
Popular stocks for Fibonacci analysis:
- Reliance Industries
- Infosys
- HDFC Bank
These stocks often show:
- Strong trends
- Respect for technical levels
Advantages of Fibonacci Retracement
Easy to Use
Available on almost all charting platforms.
Excellent Pullback Tool
Helps identify potential entry zones.
Works Across Markets
Useful in:
- Stocks
- Forex
- Crypto
- Commodities
Widely Followed
Large numbers of traders watch Fibonacci levels.
Limitations of Fibonacci Retracement
Subjective Swing Selection
Different traders may choose:
- Different swing highs
- Different swing lows
Not Always Accurate
Price may ignore Fibonacci levels.
Requires Confirmation
Should never be used alone.
Common Beginner Mistakes
Trading Every Fibonacci Level
Not every level creates a reversal.
Ignoring Market Trend
Always trade with the trend.
Ignoring Price Action
Wait for confirmation candles.
Using Fibonacci Alone
Combine with:
- RSI
- MACD
- Volume
- Support and Resistance
Best Indicators to Combine With Fibonacci
Popular combinations:
- Fibonacci + RSI
- Fibonacci + MACD
- Fibonacci + VWAP
- Fibonacci + Moving Average
- Fibonacci + Price Action
Fibonacci vs Pivot Points
| Fibonacci | Pivot Points |
|---|---|
| Dynamic levels | Fixed daily levels |
| Based on trend swings | Based on previous day’s data |
| Best for pullbacks | Best for intraday levels |
Fibonacci vs Moving Average
| Fibonacci | Moving Average |
|---|---|
| Static retracement levels | Dynamic trend indicator |
| Pullback identification | Trend identification |
Risk Management With Fibonacci
Always use:
- Stop loss
- Position sizing
- Risk-reward ratio
Example of Risk-Reward Ratio
Suppose:
- Risk = ₹20
- Target = ₹60
Risk-reward ratio:
2060=3:1
Best Timeframes for Fibonacci
| Trading Style | Timeframe |
|---|---|
| Scalping | 1-min / 5-min |
| Intraday Trading | 5-min / 15-min |
| Swing Trading | 1-hour / Daily |
| Positional Trading | Daily / Weekly |
Can Fibonacci Retracement Guarantee Profits?
No.
Fibonacci only helps identify:
- Potential support
- Potential resistance
- Pullback zones
Successful trading still requires:
- Discipline
- Risk management
- Confirmation signals
How Beginners Should Learn Fibonacci
Step 1: Understand Market Structure
Learn:
- Swing highs
- Swing lows
Step 2: Practice Drawing Fibonacci
Study historical charts.
Step 3: Combine With Other Indicators
Use confirmation before entering trades.
Step 4: Use Demo Trading
Practice before trading real money.
Fibonacci Retracement is one of the most effective tools for identifying support, resistance, and pullback opportunities. It is widely used by traders across stocks, forex, crypto, and commodities because it helps locate high-probability trading zones.
However, Fibonacci should never be used alone. Successful traders combine it with:
- RSI
- MACD
- Price Action
- Volume Analysis
- Risk Management
With proper practice and discipline, Fibonacci Retracement can become a powerful part of any trading strategy.
Frequently Asked Questions (FAQs)
1. What is Fibonacci Retracement?
A technical analysis tool used to identify potential support and resistance levels.
2. Who introduced the Fibonacci sequence?
Leonardo Fibonacci popularized the sequence.
3. What is the most important Fibonacci level?
61.8%, known as the Golden Ratio.
4. Is Fibonacci useful for intraday trading?
Yes, many intraday traders use it for pullback entries.
5. What is Fibonacci Extension?
A tool used to estimate future profit targets.
6. Does Fibonacci work in stocks?
Yes, it is widely used in stock market trading.
7. Can Fibonacci be used in crypto?
Yes, it is commonly used in cryptocurrencies.
8. Which indicators work best with Fibonacci?
RSI, MACD, VWAP, and Price Action.
9. Is Fibonacci beginner-friendly?
Yes, with practice and chart study.
10. Can Fibonacci guarantee profitable trades?
No, it only improves probability and must be combined with proper risk management.