The Double Top is a highly reliable bearish reversal pattern that appears after an uptrend. It signals that the price has hit a strong resistance level twice and is likely to reverse downward.
🔍 What is a Double Top?
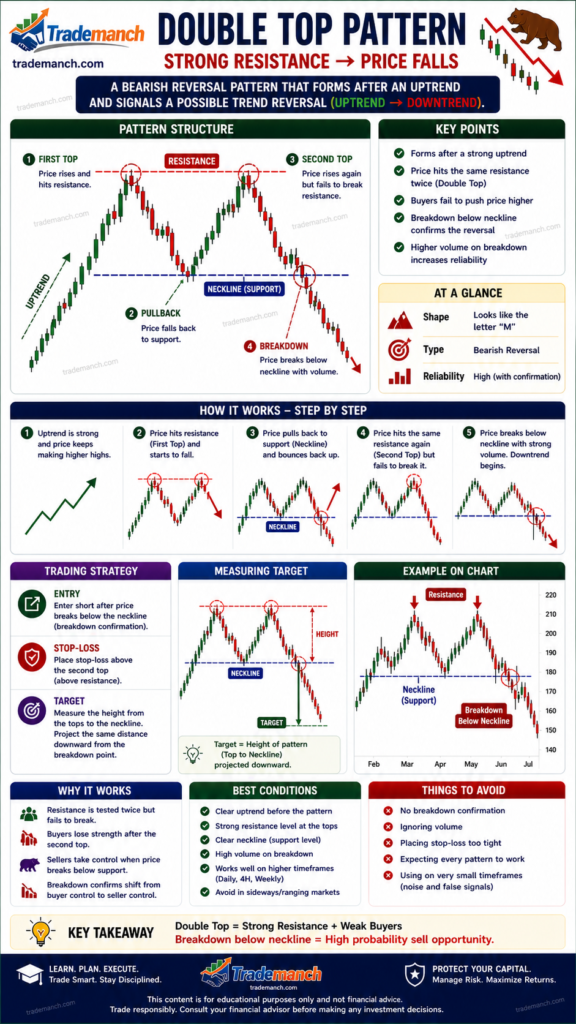
A Double Top forms when the price tries to break a resistance level two times but fails both times.
It creates an “M” shape on the chart.
📊 Structure of the Pattern
- First Top
- Price rises and faces resistance
- Sellers push price down
- Second Top
- Price rises again to the same level
- Fails to break resistance (weak bullish momentum)
- Neckline (Support Level)
- Drawn at the low between the two tops
- This is the key breakdown level
⚠️ Why It Is Bearish?
This pattern indicates:
- Buyers are unable to break resistance
- Market is losing upward momentum
- Sellers are gaining control
📉 When price breaks below the neckline, it confirms a bearish reversal
📌 How to Trade Double Top
✅ Entry Point:
- Enter a SELL trade when price breaks below the neckline
🎯 Target:
- Measure the distance from Top to Neckline
- Project the same distance downward after breakout
🛑 Stop Loss:
- Place above the second top
📈 Example Strategy
- Wait for clear M-shape formation
- Confirm breakdown with high volume
- Use indicators:
- RSI below 50
- MACD bearish crossover
🚨 Common Mistakes to Avoid
❌ Entering before neckline breakdown
❌ Confusing with sideways consolidation
❌ Ignoring volume confirmation
❌ No stop-loss placement
💡 Pro Tips
✔ Stronger pattern on higher timeframes (1H, 4H, Daily)
✔ Combine with resistance zones
✔ Fake breakouts are common—wait for confirmation
🔄 Opposite Pattern: Double Bottom
- Forms after a downtrend
- Creates a “W” shape
- Signals a bullish reversal
The Double Top pattern is powerful for:
- Identifying market tops
- Avoiding buying at resistance
- Capturing high-probability sell trades
⚠️ Disclaimer
This content is for educational purposes only and not financial advice. Always do your own research before trading.