Bollinger Bands is one of the most popular technical indicators used in trading and investing. Traders use Bollinger Bands to identify:
- Market volatility
- Overbought conditions
- Oversold conditions
- Breakouts
- Trend reversals
- Price expansion and contraction
Bollinger Bands are widely used in:
Stock market analysis
Intraday trading
Swing trading
Forex trading
Cryptocurrency trading
The indicator adapts automatically to market volatility, making it highly effective in:
- Stocks
- Forex
- Crypto
- Commodities
- Indices
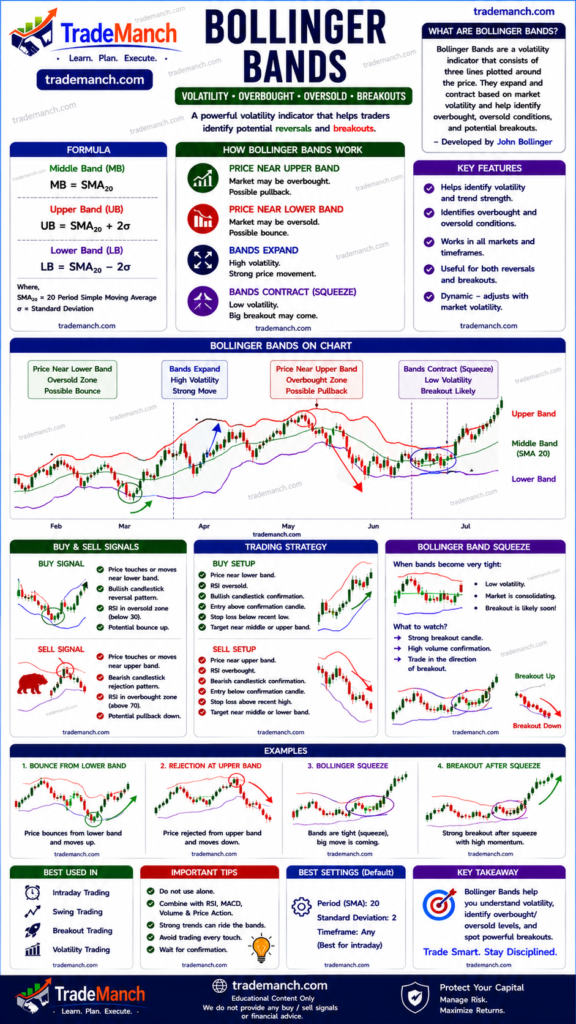
📌 What Are Bollinger Bands?
Bollinger Bands consist of three lines plotted around price:
1️⃣ Middle Band → Moving Average
2️⃣ Upper Band → Resistance/High Volatility Zone
3️⃣ Lower Band → Support/Low Volatility Zone
The bands expand and contract depending on market volatility.
📐 Bollinger Bands Formula
1️⃣ Middle Band
Usually a 20-period Simple Moving Average.
Middle Band=SMA(20)
2️⃣ Upper Band
Upper Band=SMA(20)+2σ
3️⃣ Lower Band
Lower Band=SMA(20)−2σ
Where:
- σ = Standard Deviation
- Measures market volatility
📊 Components of Bollinger Bands
| Component | Meaning |
|---|---|
| Middle Band | Trend direction |
| Upper Band | Overbought zone |
| Lower Band | Oversold zone |
| Band Width | Market volatility |
📈 How Bollinger Bands Work
The indicator expands when volatility increases and contracts when volatility decreases.
🔥 High Volatility
- Bands widen
- Strong price movement
- Possible breakout
🔥 Low Volatility
- Bands narrow
- Consolidation phase
- Breakout may come soon
📊 Important Concepts
1️⃣ Bollinger Band Squeeze
One of the most powerful setups.
Happens When:
- Bands become very narrow
Meaning:
- Volatility extremely low
- Big breakout likely soon
🟢 Bullish Breakout
Price breaks above upper band with volume.
🔴 Bearish Breakout
Price breaks below lower band.
2️⃣ Bollinger Band Expansion
Happens When:
- Bands widen rapidly
Meaning:
- Volatility increasing
- Strong trend underway
3️⃣ Walking the Band
In strong trends:
- Price may continuously touch upper/lower band
🟢 Uptrend
Price rides upper band.
🔴 Downtrend
Price rides lower band.
Important:
This does NOT always mean reversal.
📈 Overbought & Oversold Conditions
🔴 Overbought Zone
When price touches or moves above upper band:
- Market may be overextended
- Pullback possible
🟢 Oversold Zone
When price touches or falls below lower band:
- Market may be undervalued
- Bounce possible
⚠️ Important Note
Price touching bands alone is NOT a buy/sell signal.
Confirmation is required.
🔥 Bollinger Bands Trading Strategies
1️⃣ Mean Reversion Strategy
Markets often return toward the middle band.
🟢 Buy Setup
- Price touches lower band
- Bullish candle appears
- RSI/Stochastic oversold
Related indicators:
- RSI
- Stochastic Oscillator
🔴 Sell Setup
- Price touches upper band
- Bearish rejection appears
2️⃣ Bollinger Squeeze Breakout Strategy
Very popular among intraday traders.
🟢 Bullish Setup
- Bands contract
- Price breaks upper band
- Volume increases
Meaning:
Strong bullish breakout.
🔴 Bearish Setup
- Bands contract
- Price breaks lower band
Meaning:
Strong bearish breakout.
3️⃣ Trend Following Strategy
During strong trends:
- Price remains near one band
- Middle band acts as support/resistance
🟢 Uptrend
- Price above middle band
- Upper band continuously tested
🔴 Downtrend
- Price below middle band
- Lower band repeatedly tested
4️⃣ Double Bottom Bollinger Setup
Structure:
- First low below lower band
- Second low inside band
Meaning:
Selling pressure weakening → bullish reversal possible.
📊 Best Settings for Bollinger Bands
| Trading Style | Setting |
|---|---|
| Default | 20,2 |
| Scalping | 10,1.5 |
| Swing Trading | 20,2 |
| Long-Term | 50,2 |
📈 Bollinger Bands with Other Indicators
✅ Bollinger Bands + RSI
Best for:
- Reversal trading
- Overbought/oversold confirmation
Related indicator:
RSI
✅ Bollinger Bands + MACD
Best for:
- Trend confirmation
- Momentum continuation
Related indicator:
MACD
✅ Bollinger Bands + EMA
Best for:
- Dynamic trend analysis
- Pullback entries
Related indicator:
EMA
✅ Bollinger Bands + Volume Profile
Best for:
- Institutional breakout confirmation
Related tool:
Volume Profile
📊 Best Timeframes
| Trading Style | Timeframe |
|---|---|
| Scalping | 1–5 Min |
| Intraday | 5–15 Min |
| Swing Trading | 1 Hour – Daily |
| Positional Trading | Daily – Weekly |
🔥 Advantages of Bollinger Bands
✔ Measures volatility dynamically
✔ Identifies breakout opportunities
✔ Helps spot reversals
✔ Excellent for range trading
✔ Useful in all markets
✔ Works with multiple strategies
❌ Disadvantages of Bollinger Bands
✖ False breakouts possible
✖ Weak signals in trending markets alone
✖ Requires confirmation indicators
✖ Can lag during sudden volatility
⚠️ Common Mistakes Traders Make
❌ Selling every upper band touch
❌ Buying every lower band touch
❌ Ignoring trend direction
❌ Trading without volume confirmation
❌ Using Bollinger Bands alone
🎯 Professional Trading Tips
✅ Use Bollinger Squeeze for breakout trades
✅ Confirm with volume
✅ Trade with overall trend
✅ Combine with RSI or MACD
✅ Watch price action carefully
✅ Use stop-loss management
📊 Bollinger Bands in Different Markets
Highly effective in:
- Stocks
- Forex
- Crypto
- Commodities
- Indices
Popular examples:
- NIFTY
- BANKNIFTY
- Bitcoin
- S&P 500
Bollinger Bands vs RSI
| Bollinger Bands | RSI |
|---|---|
| Measures volatility | Measures momentum |
| Dynamic price bands | Oscillator indicator |
| Useful for breakout setups | Useful for overbought/oversold |
Many traders combine both indicators.
Frequently Asked Questions (FAQs)
1. What are Bollinger Bands?
Bollinger Bands are volatility-based technical indicators.
2. Who created Bollinger Bands?
They were developed by John Bollinger.
3. What does Bollinger Band squeeze mean?
It indicates low volatility and possible breakout.
4. What happens when price touches upper band?
It may indicate strong bullish momentum or overbought condition.
5. What happens when price touches lower band?
It may indicate bearish weakness or oversold condition.
6. Are Bollinger Bands good for intraday trading?
Yes, they are widely used in intraday trading.
7. Which indicators work best with Bollinger Bands?
RSI, MACD, and VWAP are commonly combined.
8. Can beginners use Bollinger Bands?
Yes, they are beginner-friendly with practice.
9. Do Bollinger Bands work in crypto trading?
Yes, they are popular in crypto markets.
10. Can Bollinger Bands guarantee profits?
No, all indicators only improve probability and not certainty.