
Fundamental analysis is one of the most important methods used by investors to evaluate stocks and identify good companies for long-term investment. Successful investors like Warren Buffett focus heavily on fundamental analysis before investing in any company.
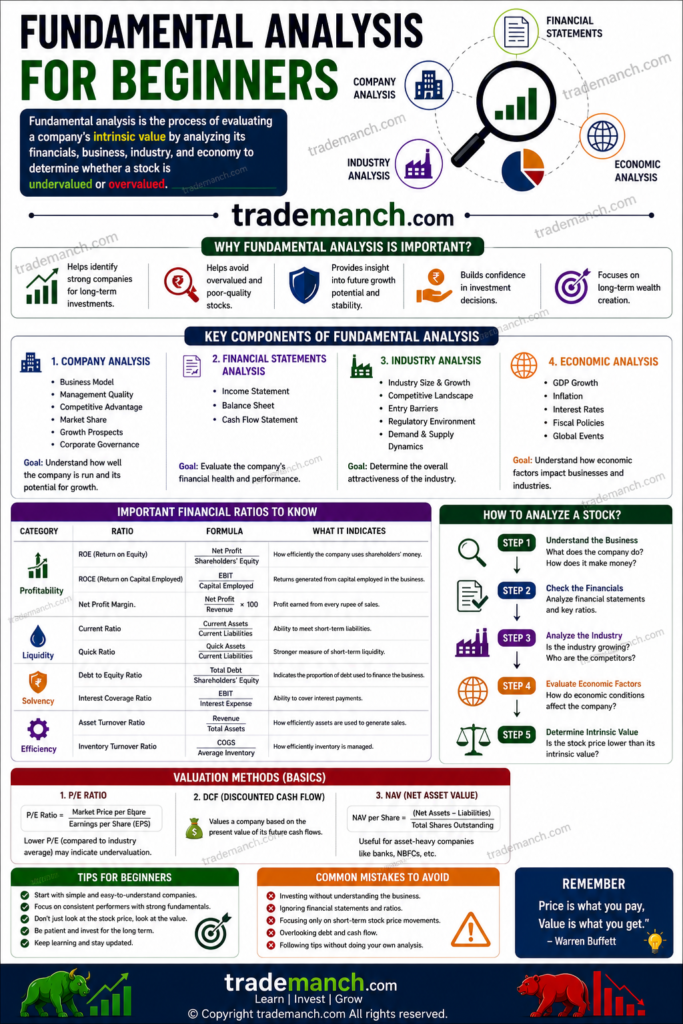
For beginners, understanding fundamental analysis is essential because it helps investors:
- Find strong companies
- Avoid weak businesses
- Make informed investment decisions
- Build long-term wealth
In this complete beginner-friendly guide, you will learn what fundamental analysis is, how it works, important financial terms, key ratios, and how to analyze stocks step by step.
What Is Fundamental Analysis?
Fundamental analysis is the process of evaluating a company’s:
- Financial health
- Business performance
- Industry position
- Future growth potential
to determine whether its stock is worth buying.
In simple words:
- Fundamental analysis helps investors identify the real value of a company.
Simple Definition of Fundamental Analysis
Fundamental analysis means studying a company’s business and financial performance before investing.
Why Fundamental Analysis Is Important
Fundamental analysis helps investors:
- Choose strong companies
- Avoid risky investments
- Understand company growth
- Make long-term investment decisions
It focuses on:
- Company quality
- Financial stability
- Profitability
- Future potential
Fundamental Analysis vs Technical Analysis
| Fundamental Analysis | Technical Analysis |
|---|---|
| Studies company fundamentals | Studies price charts |
| Focuses on long-term investing | Focuses on trading |
| Uses financial statements | Uses indicators and patterns |
| Evaluates company value | Evaluates market behavior |
Many investors use both methods together.
Main Components of Fundamental Analysis
Fundamental analysis mainly includes:
- Company Analysis
- Financial Statement Analysis
- Industry Analysis
- Economic Analysis
1. Company Analysis
Investors study:
- Business model
- Products and services
- Competitive advantage
- Management quality
- Market position
Strong companies usually have:
- Trusted brands
- Consistent profits
- Growth potential
Examples:
- Reliance Industries
- Infosys
- Tata Consultancy Services
2. Financial Statement Analysis
Financial statements help investors understand company performance.
The three main financial statements are:
- Income Statement
- Balance Sheet
- Cash Flow Statement
Income Statement
Shows:
- Revenue
- Expenses
- Profit
- Net income
Investors analyze whether profits are growing consistently.
Balance Sheet
Shows:
- Assets
- Liabilities
- Equity
Helps evaluate company financial strength.
Cash Flow Statement
Shows:
- Cash inflows
- Cash outflows
Positive cash flow indicates healthy business operations.
3. Industry Analysis
Even good companies may struggle in weak industries.
Investors analyze:
- Industry growth
- Competition
- Future demand
- Government regulations
4. Economic Analysis
Economic conditions affect stock markets.
Factors include:
- Inflation
- Interest rates
- GDP growth
- Government policies
Strong economies generally support company growth.
Important Financial Terms for Beginners
Revenue
Revenue is the total income generated from business operations.
Higher revenue growth usually indicates business expansion.
Profit
Profit is the money left after expenses are deducted.
Companies aim to increase profits over time.
Earnings Per Share (EPS)
EPS shows company profit per share.
Formula:
EPS=Total Outstanding SharesNet Profit
Higher EPS generally indicates better profitability.
Price-to-Earnings Ratio (P/E Ratio)
P/E ratio helps determine stock valuation.
Formula:
P/E=EPSShare Price
Example of P/E Ratio
Suppose:
- Share price = ₹500
- EPS = ₹25
P/E ratio:
25500=20
P/E ratio = 20.
What Does P/E Ratio Mean?
- High P/E may indicate growth expectations.
- Low P/E may indicate undervaluation or weak growth.
P/E should always be compared with:
- Industry average
- Company growth rate
Debt-to-Equity Ratio
This ratio measures company debt levels.
Formula:
Debt-to-Equity Ratio=Shareholders’ EquityTotal Debt
Lower debt is generally safer.
Return on Equity (ROE)
ROE measures how efficiently a company uses shareholder money.
Formula:
ROE=Shareholders’ EquityNet Income×100
Higher ROE often indicates better management efficiency.
Dividend Yield
Dividend yield shows dividend return compared to share price.
Formula:
Dividend Yield=Share PriceAnnual Dividend×100
What Is Intrinsic Value?
Intrinsic value means the actual value of a stock based on company fundamentals.
If:
- Market price < intrinsic value → Stock may be undervalued.
- Market price > intrinsic value → Stock may be overvalued.
Qualitative Factors in Fundamental Analysis
Not all analysis is based on numbers.
Investors also study:
- Brand reputation
- Management quality
- Innovation
- Competitive advantage
- Customer loyalty
What Is a Moat in Investing?
A moat is a company’s competitive advantage that protects it from competitors.
Examples:
- Strong brand
- Technology leadership
- Large customer base
Companies with strong moats often perform well long term.
Fundamental Analysis Process Step-by-Step
Step 1: Understand the Business
Learn:
- What the company does
- How it earns money
- Industry position
Step 2: Study Financial Statements
Analyze:
- Revenue growth
- Profit growth
- Debt levels
- Cash flow
Step 3: Check Financial Ratios
Evaluate:
- P/E ratio
- EPS
- ROE
- Debt-to-equity ratio
Step 4: Analyze Industry
Understand:
- Competition
- Market growth
- Future opportunities
Step 5: Evaluate Management
Strong management is critical for long-term success.
Step 6: Compare Valuation
Determine whether stock price is reasonable.
What Are Blue-Chip Stocks?
Blue-chip stocks are:
- Large companies
- Financially stable
- Well-established businesses
Examples:
- HDFC Bank
- Infosys
- ITC
These are generally safer for beginners.
Advantages of Fundamental Analysis
Long-Term Wealth Creation
Helps identify strong businesses.
Better Investment Decisions
Reduces emotional investing.
Lower Risk
Strong companies are relatively safer.
Focus on Company Quality
Investors understand business fundamentals deeply.
Limitations of Fundamental Analysis
Time-Consuming
Requires detailed research.
Market Uncertainty
Good companies may still fall during market crashes.
Future Predictions Are Difficult
Business conditions can change unexpectedly.
Common Mistakes Beginners Make
Investing Without Research
Never invest blindly.
Following Market Hype
Avoid emotional investing.
Ignoring Debt Levels
High debt increases risk.
Focusing Only on Cheap Stocks
Low-priced stocks are not always good investments.
Ignoring Industry Trends
Industry weakness affects company performance.
Fundamental Analysis for Long-Term Investing
Fundamental analysis works best for:
- Long-term investors
- Wealth creation
- Retirement planning
- Value investing
Best Sources for Company Analysis
Investors use:
- Annual reports
- Quarterly results
- Company websites
- Stock market platforms
- Financial news
Tips for Beginners
Start With Large Companies
Blue-chip stocks are relatively safer.
Focus on Learning
Understand financial statements gradually.
Think Long Term
Avoid short-term emotional decisions.
Diversify Investments
Spread risk across multiple companies.
Stay Patient
Wealth creation takes time.
Fundamental analysis is one of the most powerful methods for evaluating stocks and making informed investment decisions. It helps investors understand company quality, financial strength, growth potential, and valuation before investing.
Beginners should focus on learning financial basics, analyzing strong businesses, managing risk, and investing with a long-term mindset. Successful investing is not about finding quick profits, but about identifying quality companies and staying invested patiently over time.
Frequently Asked Questions (FAQs)
1. What is fundamental analysis?
Fundamental analysis is the process of evaluating a company’s financial and business performance before investing.
2. Why is fundamental analysis important?
It helps investors identify strong companies and make informed decisions.
3. What are the main financial statements?
Income statement, balance sheet, and cash flow statement.
4. What is P/E ratio?
P/E ratio compares stock price with earnings per share.
5. What is EPS?
EPS means Earnings Per Share, showing company profit per share.
6. Is fundamental analysis good for beginners?
Yes, it helps beginners understand long-term investing.
7. What are blue-chip stocks?
Large, stable, and financially strong companies.
8. What is intrinsic value?
Intrinsic value is the estimated real value of a stock.
9. Can fundamental analysis guarantee profits?
No, all investments involve risk.
10. Which companies are good for beginners to study?
Beginners often study companies like Infosys, HDFC Bank, and Reliance Industries.