The Ascending Triangle is a popular bullish continuation chart pattern that signals the likelihood of price continuing its upward trend. It is widely used by traders to identify breakout opportunities in trending markets.
🔍 What is an Ascending Triangle?
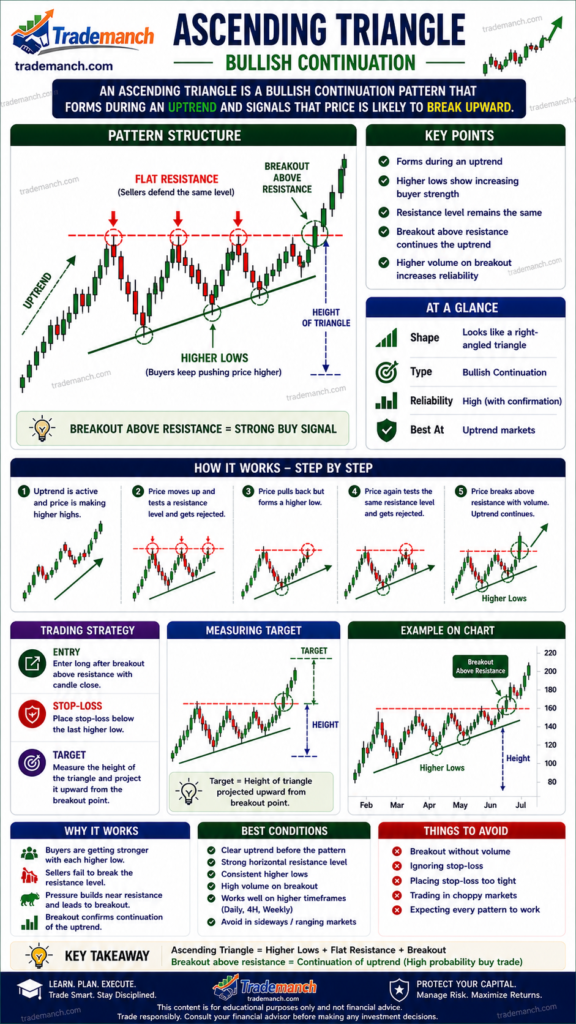
An Ascending Triangle forms when the price creates:
- A horizontal resistance level (flat top)
- A rising trendline (higher lows)
This structure shows that buyers are becoming stronger, gradually pushing the price toward a breakout.
📈 Structure of Ascending Triangle
The pattern consists of:
- Resistance Line (Flat Top): Price faces rejection at a fixed level multiple times
- Higher Lows: Buyers step in earlier each time, forming an upward trendline
- Breakout: Price breaks above resistance, confirming bullish continuation
🧠 Market Psychology
- Sellers defend a resistance level repeatedly ❌
- Buyers become more aggressive with each dip ✅
- Pressure builds → leads to a bullish breakout
This creates a strong continuation signal in an existing uptrend.
🚀 How to Trade Ascending Triangle
✅ Entry Point
- Enter after breakout above resistance with strong volume
🛑 Stop Loss
- Place stop loss below the rising trendline
🎯 Target Price
- Measure the height of the triangle (Resistance – Lowest Low)
- Add it to the breakout point
📊 Key Characteristics
- Flat resistance line
- Rising support trendline
- At least 2–3 touches on both levels
- Volume increases during breakout
- Typically appears in an uptrend
⚠️ Important Tips
- Wait for confirmed breakout to avoid false signals
- Combine with indicators like RSI, MACD, Moving Averages
- Breakouts with low volume may fail
- Works well on intraday and higher timeframes