
he Inverse Head and Shoulders Pattern is one of the most reliable bullish reversal patterns in technical analysis. It typically appears after a prolonged downtrend and signals that selling pressure is weakening while buyers are gradually taking control.
Professional traders and investors use the Inverse Head and Shoulders pattern to identify potential market bottoms, trend reversals, and high-probability buying opportunities.
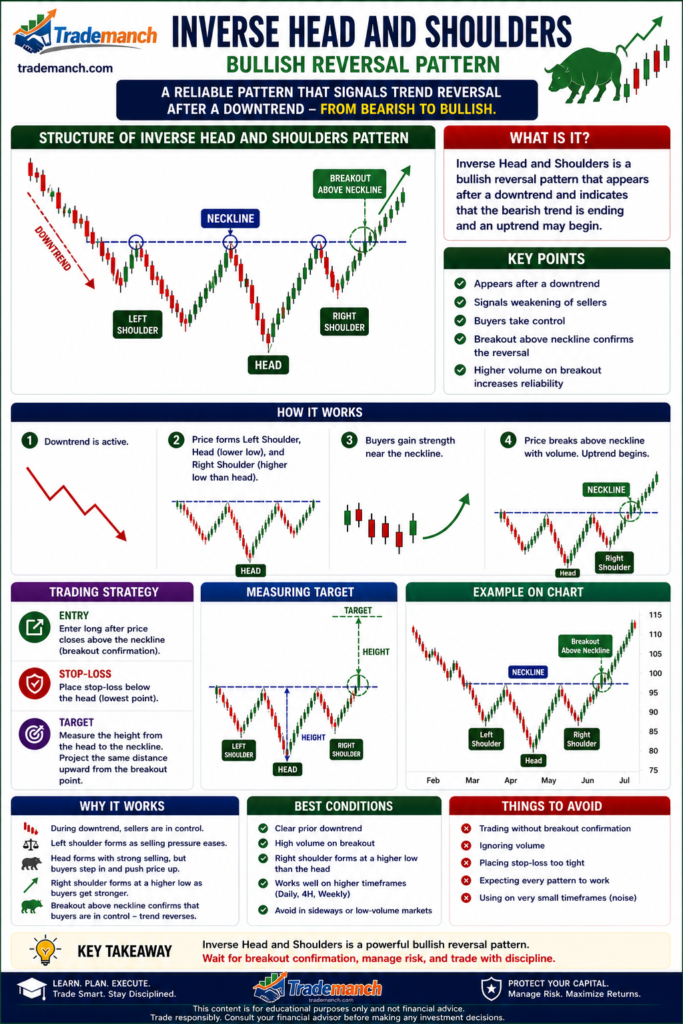
This guide explains the Inverse Head and Shoulders pattern in simple language with practical examples and trading strategies.
What Is an Inverse Head and Shoulders Pattern?
An Inverse Head and Shoulders is a bullish reversal chart pattern that forms after a downtrend.
It consists of three consecutive lows:
- Left Shoulder
- Head
- Right Shoulder
The middle low (Head) is deeper than the other two lows.
Simple Definition of Inverse Head and Shoulders
An Inverse Head and Shoulders pattern signals that a downtrend may be ending and an uptrend could begin.
Why Is It Called Inverse Head and Shoulders?
The pattern is the upside-down version of the traditional Head and Shoulders pattern.
Structure:
Left Shoulder
First bottom.
Head
Lowest bottom.
Right Shoulder
Third bottom, usually similar to the left shoulder.
Components of an Inverse Head and Shoulders Pattern
Left Shoulder
Price declines and forms a low.
A temporary bounce follows.
Head
Price declines again and creates a lower low.
This forms the head.
Another recovery follows.
Right Shoulder
Price declines once more but fails to make a new low.
This creates the right shoulder.
Neckline
A resistance line connecting the highs between the shoulders and head.
The neckline is the most important part of the pattern.
Structure of the Pattern
A typical pattern consists of:
Bottom 1
Left Shoulder
Bottom 2
Head (Lowest Point)
Bottom 3
Right Shoulder
Resistance Line
Neckline
Market Psychology Behind the Pattern
Understanding the psychology makes the pattern easier to trust.
Stage 1: Strong Downtrend
Sellers dominate the market.
Prices continue making lower lows.
Stage 2: Left Shoulder Forms
The market creates a temporary low.
Buyers show initial interest.
Stage 3: Head Forms
Sellers push prices to a new low.
However, strong buying emerges.
Stage 4: Right Shoulder Forms
Sellers attempt another decline.
This time they fail to create a lower low.
A sign of strength appears.
Stage 5: Neckline Breakout
Buyers gain control.
The bearish trend begins reversing.
Why the Inverse Head and Shoulders Is Bullish
The pattern shows:
- Weakening seller momentum
- Increasing buyer strength
- Failure to create new lows
These factors often indicate a bullish reversal.
Importance of the Neckline
The neckline acts as a major resistance level.
Pattern Is Not Confirmed Until
Price breaks above the neckline.
Neckline Breakout
Signals that buyers have taken control.
Types of Necklines
Horizontal Neckline
Most common and easiest to identify.
Ascending Neckline
Slopes upward.
Often indicates stronger bullish momentum.
Descending Neckline
Slopes downward.
Still considered valid.
How to Confirm an Inverse Head and Shoulders
Confirmation is crucial.
Price Breaks Above Neckline
Primary confirmation signal.
Strong Volume
Breakout volume should increase significantly.
Follow-Through Buying
Additional bullish confirmation.
Volume Analysis
Volume often confirms the strength of the pattern.
Left Shoulder
Moderate volume.
Head
Volume may decline.
Right Shoulder
Volume remains lower.
Neckline Breakout
Volume should increase sharply.
This confirms buyer participation.
Trading Strategy Using Inverse Head and Shoulders
Step 1
Identify an existing downtrend.
Step 2
Locate the three bottoms.
Step 3
Draw the neckline.
Step 4
Wait for a breakout above the neckline.
Step 5
Enter after confirmation.
Entry Strategy
Aggressive Entry
Immediately after neckline breakout.
Conservative Entry
Wait for a retest of the neckline.
Stop-Loss Placement
Risk management is essential.
Common Stop-Loss Level
Below the right shoulder.
Alternative Method
Below the neckline retest.
Profit Target Calculation
The target is calculated using:
Pattern Height
Distance between Head and Neckline.
Formula:
Target=Neckline+(Neckline−Head)
Example
Suppose:
Head = ₹800
Neckline = ₹900
Pattern Height:
900−800=100
Target:
900+100=1000
Potential Target = ₹1,000
Inverse Head and Shoulders vs Double Bottom
| Feature | Inverse Head and Shoulders | Double Bottom |
|---|---|---|
| Bottoms | Three | Two |
| Reliability | Very High | High |
| Complexity | Moderate | Simple |
| Signal | Bullish Reversal | Bullish Reversal |
Inverse Head and Shoulders vs Head and Shoulders
| Feature | Inverse Head and Shoulders | Head and Shoulders |
|---|---|---|
| Signal | Bullish | Bearish |
| Trend Before Pattern | Downtrend | Uptrend |
| Breakout Direction | Upward | Downward |
| Market Psychology | Buyers Gaining Control | Sellers Gaining Control |
Best Indicators to Use with the Pattern
RSI (Relative Strength Index)
Look for:
Bullish Divergence
Improves reliability.
MACD
Bullish crossover confirms momentum.
Moving Averages
Support trend reversal analysis.
Volume Analysis
Validates breakout strength.
Advantages of Inverse Head and Shoulders
Highly Reliable
One of the strongest bullish reversal patterns.
Clear Entry and Exit Levels
Easy trade planning.
Works Across Markets
Stocks, forex, commodities, and cryptocurrencies.
Strong Risk Management Framework
Provides logical stop-loss placement.
Limitations of Inverse Head and Shoulders
False Breakouts
Can occur without confirmation.
Requires Patience
Pattern formation may take time.
Volume Confirmation Needed
Breakout volume improves reliability.
Common Beginner Mistakes
Buying Before Neckline Breakout
Always wait for confirmation.
Ignoring Volume
Volume strengthens the signal.
Forcing Pattern Recognition
Only trade clear formations.
No Stop-Loss
Risk management remains essential.
Best Time Frames for Trading
Intraday Trading
15-minute and 30-minute charts.
Swing Trading
Daily charts.
Positional Trading
Weekly charts.
Practical Example
Suppose a stock:
- Falls from ₹1,200 to ₹800
- Forms an Inverse Head and Shoulders pattern
- Breaks neckline resistance at ₹900
Possible Setup:
Entry
Above ₹900
Stop-Loss
Below the right shoulder
Target
Based on pattern height
How Reliable Is the Inverse Head and Shoulders Pattern?
The Inverse Head and Shoulders is considered one of the most reliable bullish reversal patterns because:
- Seller strength weakens progressively.
- Buyer participation increases.
- Breakout confirmation is clearly defined.
However, no pattern guarantees success.
Best Combination for Beginners
Use:
Inverse Head and Shoulders Pattern
Support & Resistance
RSI
Volume Analysis
for stronger bullish setups.
The Inverse Head and Shoulders Pattern is a powerful bullish reversal signal that often marks the transition from a downtrend to an uptrend. It reflects weakening seller control and increasing buyer confidence, making it one of the most trusted chart patterns in technical analysis.
When combined with volume confirmation, RSI, MACD, and proper risk management, the pattern can help traders identify high-probability buying opportunities.
Remember: always wait for a neckline breakout before entering a trade. Confirmation and discipline are key to successful trading.
Frequently Asked Questions (FAQs)
1. What is an Inverse Head and Shoulders Pattern?
An Inverse Head and Shoulders is a bullish reversal chart pattern that forms after a downtrend.
2. Why is the pattern considered bullish?
It shows weakening selling pressure and increasing buyer strength.
3. What is the neckline?
The neckline is a resistance line connecting the highs between the shoulders and head.
4. When is the pattern confirmed?
The pattern is confirmed when price breaks above the neckline.
5. What is the ideal stop-loss placement?
Below the right shoulder or below the neckline retest.
6. Why is volume important?
High breakout volume increases the reliability of the pattern.
7. How is the profit target calculated?
By adding the pattern height to the neckline breakout level.
8. Which indicators work best with the pattern?
RSI, MACD, Moving Averages, and Volume Analysis.
9. Can the pattern fail?
Yes. False breakouts can occur.
10. Is the Inverse Head and Shoulders suitable for beginners?
Yes. It is one of the most reliable bullish reversal patterns and is widely used by beginner and professional traders alike.