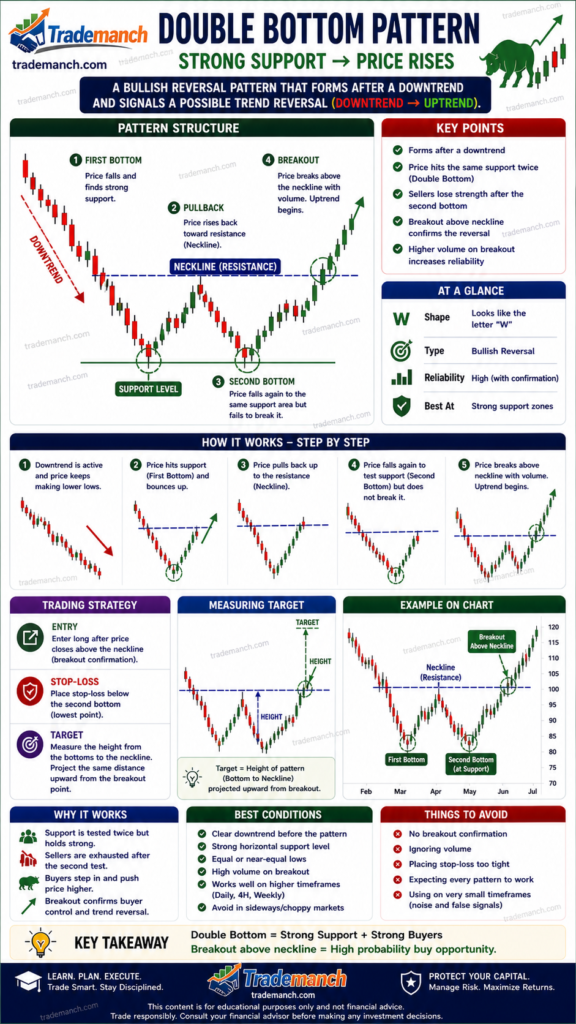
The Double Bottom is a powerful bullish reversal pattern that appears after a downtrend. It signals that the price has found a strong support level and is likely to move upward.
🔍 What is a Double Bottom?
A Double Bottom forms when the price tests a support level twice but fails to break it, creating a “W” shape on the chart.
📊 Structure of the Pattern
- First Bottom
- Price falls and finds support
- Buyers push price upward
- Second Bottom
- Price drops again to the same level
- Fails to break support (selling pressure weakens)
- Neckline (Resistance Level)
- Drawn at the high between the two bottoms
- This is the key breakout level
🚀 Why It Is Bullish?
This pattern indicates:
- Sellers are losing control
- Support level is strong and respected
- Buyers are gaining strength
📈 When price breaks above the neckline, it confirms a bullish reversal
📌 How to Trade Double Bottom
✅ Entry Point:
- Enter a BUY trade when price breaks above the neckline
🎯 Target:
- Measure the distance from Bottom to Neckline
- Project the same distance upward after breakout
🛑 Stop Loss:
- Place below the second bottom
📈 Example Strategy
- Wait for a clear W-shape formation
- Confirm breakout with strong volume
- Use indicators:
- RSI above 50
- MACD bullish crossover
🚨 Common Mistakes to Avoid
❌ Entering before breakout confirmation
❌ Ignoring volume during breakout
❌ Confusing with sideways movement
❌ Skipping stop-loss
💡 Pro Tips
✔ Works best on 1H, 4H, and Daily charts
✔ Combine with support zones & trendlines
✔ Strong breakout = high probability trade
🔄 Opposite Pattern: Double Top
- Forms after an uptrend
- Creates an “M” shape
- Signals a bearish reversal
The Double Bottom pattern helps traders:
- Identify market bottoms
- Catch the start of new uptrends
- Improve risk-reward trading setups
⚠️ Disclaimer
This content is for educational purposes only and not financial advice. Always do your own research before trading.