🔍 What is a Spinning Top Pattern?
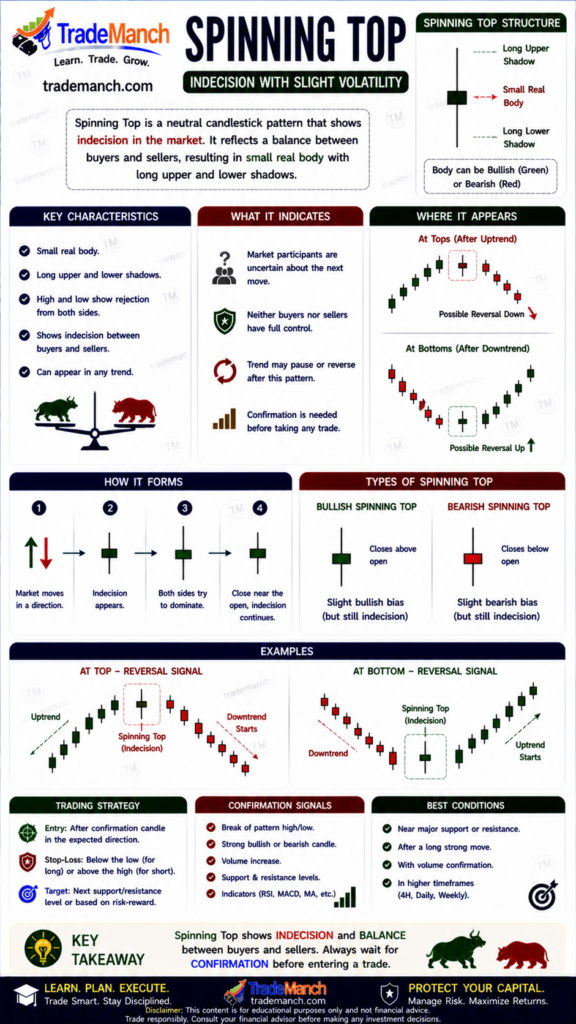
The Spinning Top candlestick pattern is a sign of market indecision where buyers and sellers are both active, but neither side gains full control.
👉 It reflects uncertainty in the market and may signal a trend pause or possible reversal.
📈 Key Features of a Spinning Top
- 📦 Small real body
- 📏 Upper and lower shadows are longer than the body
- ⚖️ Indicates balance between buyers and sellers
- 📍 Can appear in both uptrends and downtrends
💡 Psychology Behind the Pattern
The Spinning Top reflects a battle between bulls and bears:
- Buyers push price upward
- Sellers push price downward
- Price closes near the opening level
👉 This shows neither side could dominate the session completely.
🟢 Bullish Spinning Top
📈 Appears After a Downtrend
- Suggests sellers may be losing momentum
- Buyers are beginning to enter the market
👉 Could signal a potential bullish reversal if confirmed.
🔴 Bearish Spinning Top
📉 Appears After an Uptrend
- Suggests buyers may be weakening
- Sellers are starting to apply pressure
👉 Could signal a potential bearish reversal if confirmed.
✅ How to Trade the Spinning Top
🔹 Step-by-Step Strategy:
- Identify Market Trend
Check whether the pattern appears after an uptrend or downtrend. - Spot the Small Body with Long Wicks
Key sign of indecision and volatility. - Wait for Confirmation Candle
Next candle determines market direction. - Entry Point
- Buy after bullish confirmation
- Sell after bearish confirmation
- Stop Loss
Place beyond the high/low of the spinning top. - Target
Use support/resistance or trend continuation targets.
⚠️ Common Mistakes to Avoid
- ❌ Trading without confirmation
- ❌ Ignoring overall trend direction
- ❌ Confusing with Doji candles
- ❌ Using in low-volume markets
🔗 Spinning Top vs Doji
| Pattern | Body Size | Signal |
|---|---|---|
| Spinning Top | Small body | Indecision with volatility |
| Doji | Almost no body | Stronger indecision |
👉 Doji shows stronger uncertainty compared to Spinning Top.
🚀 Pro Tips for Better Accuracy
- Combine with Support & Resistance Zones
- Use RSI for overbought/oversold signals
- Watch for volume confirmation
- Confirm with higher timeframe analysis
The Spinning Top pattern is an important signal of market hesitation and slight volatility. While it does not confirm reversal on its own, it warns traders that momentum may be weakening.
👉 Always wait for confirmation before making trading decisions.