
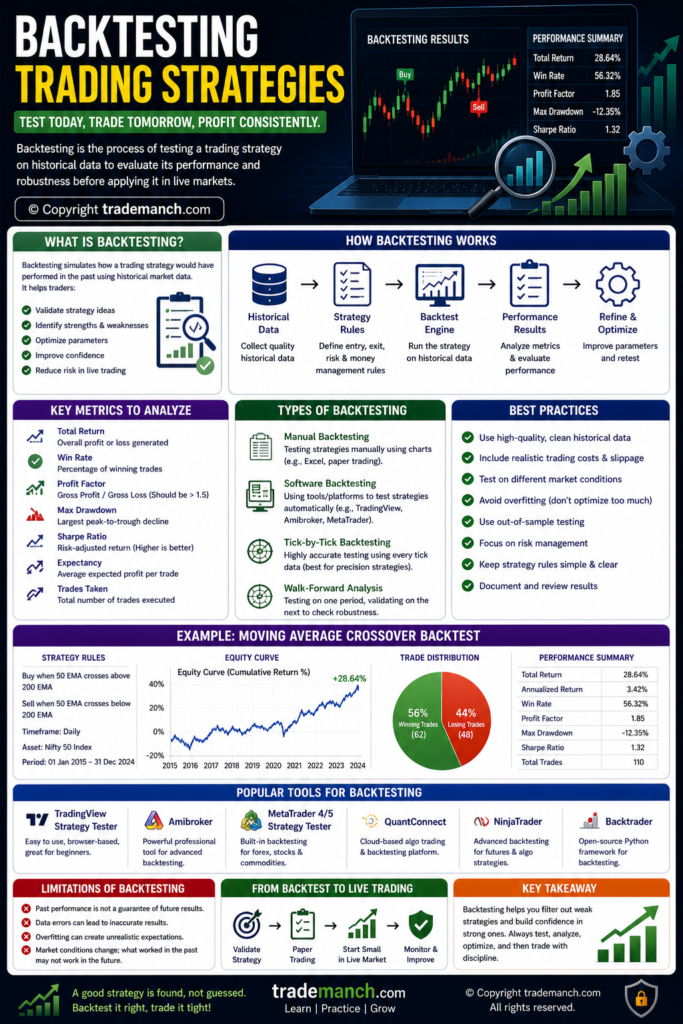
Backtesting is one of the most important skills every trader should learn before risking real money in the market. Professional traders and institutions rarely use a strategy without testing it first. Backtesting helps determine whether a trading strategy has worked in the past and whether it may have potential in future market conditions.
Many beginner traders jump directly into live trading after learning a strategy. This often leads to losses because they do not know the strengths, weaknesses, or expected performance of their system.
In this complete beginner guide, you will learn what backtesting is, why it is important, how to backtest a strategy, common mistakes, tools, advantages, limitations, and best practices.
What Is Backtesting?
Backtesting is the process of testing a trading strategy using historical market data to evaluate how it would have performed in the past.
The goal is to determine:
- Profitability
- Win rate
- Risk level
- Drawdowns
- Consistency
- Overall effectiveness
By testing historical data, traders can gain confidence before applying a strategy in live markets.
Simple Definition of Backtesting
Backtesting means applying a trading strategy to historical price charts to see how it would have performed in previous market conditions.
Why Is Backtesting Important?
Backtesting helps traders:
- Validate trading strategies
- Build confidence
- Improve risk management
- Identify weaknesses
- Avoid emotional decision-making
- Improve consistency
Without backtesting, trading becomes guesswork.
Benefits of Backtesting
1. Reduces Risk
You understand the potential risks of a strategy before investing real money.
2. Builds Confidence
A tested strategy provides psychological confidence during market fluctuations.
3. Identifies Weaknesses
Backtesting reveals situations where a strategy performs poorly.
4. Improves Discipline
Traders learn to follow predefined rules.
5. Saves Time and Money
Testing historical data is much cheaper than learning through costly trading mistakes.
How Backtesting Works
Backtesting involves:
- Selecting a strategy
- Gathering historical data
- Applying trading rules
- Recording results
- Analyzing performance
The process simulates how the strategy would have performed historically.
Example of a Simple Strategy
Suppose your trading rules are:
Buy Conditions
- Price above 50 EMA
- RSI above 50
Sell Conditions
- Price below 50 EMA
- RSI below 50
You would apply these rules to historical charts and record every trade.
Types of Backtesting
Manual Backtesting
Manual backtesting involves reviewing charts one candle at a time.
Advantages:
- Improves chart-reading skills
- Helps understand market behavior
Disadvantages:
- Time-consuming
Automated Backtesting
Automated software tests strategies using algorithms.
Advantages:
- Faster
- More accurate
- Handles large datasets
Disadvantages:
- Requires technical setup
Step-by-Step Backtesting Process
Step 1: Choose a Trading Strategy
Select a strategy with clear rules.
Example:
- Moving Average Crossover
- RSI Strategy
- Breakout Strategy
- Price Action Strategy
Avoid vague trading rules.
Step 2: Select a Market
Choose one market:
- Stocks
- Forex
- Cryptocurrency
- Commodities
Focus on one market initially.
Step 3: Choose a Timeframe
Examples:
- 5-minute chart
- 15-minute chart
- Hourly chart
- Daily chart
Use the same timeframe you plan to trade live.
Step 4: Gather Historical Data
You need:
- Open price
- High price
- Low price
- Close price
- Volume data
The more data you test, the more reliable your results become.
Step 5: Apply Trading Rules
For each setup:
Record:
- Entry price
- Stop loss
- Target
- Exit price
Follow the strategy exactly.
Step 6: Record Results
Create a spreadsheet containing:
- Trade number
- Entry date
- Exit date
- Profit/Loss
- Risk-Reward Ratio
Tracking data helps identify performance patterns.
Important Backtesting Metrics
Win Rate
Win rate measures the percentage of winning trades.
Formula:
Win Rate=Total TradesWinning Trades×100
Example:
- Winning Trades = 60
- Total Trades = 100
Win Rate:
10060×100=60%
Risk-Reward Ratio
Measures potential profit relative to risk.
Example:
- Risk = ₹500
- Reward = ₹1500
Calculation:
5001500=3:1
Maximum Drawdown
Maximum drawdown measures the largest decline in account value during testing.
Lower drawdowns are generally preferable.
Profit Factor
Profit Factor measures strategy efficiency.
Formula:
Profit Factor=Gross LossGross Profit
A value above 1 generally indicates profitability.
How Much Historical Data Should You Test?
General guideline:
| Trading Style | Recommended Data |
|---|---|
| Scalping | 3–6 Months |
| Intraday Trading | 6–12 Months |
| Swing Trading | 1–3 Years |
| Positional Trading | 3–10 Years |
More data usually improves reliability.
Popular Backtesting Tools
Many traders use:
- TradingView
- TradingView
- MetaTrader 5
- NinjaTrader
These platforms provide historical chart data and testing tools.
Manual Backtesting Example
Suppose you are testing:
- 50 EMA Strategy
Review one year of charts.
Whenever your rules appear:
- Record entry
- Record stop loss
- Record target
- Track outcome
After 100 trades, analyze the results.
Common Backtesting Mistakes
Changing Rules Mid-Test
Always use the same rules throughout the test.
Using Too Little Data
Testing only a few trades may produce misleading results.
Ignoring Trading Costs
Consider:
- Brokerage fees
- Slippage
- Taxes
Curve Fitting
Avoid adjusting a strategy excessively to fit historical data.
A strategy should work across different market conditions.
Cherry Picking Trades
Record every valid setup.
Do not ignore losing trades.
What Is Forward Testing?
After successful backtesting:
Perform forward testing.
Forward testing means:
- Applying the strategy in real-time
- Using a demo account
This helps verify whether historical performance continues in current markets.
Backtesting vs Paper Trading
| Backtesting | Paper Trading |
|---|---|
| Historical Data | Live Market Data |
| Past Performance | Current Performance |
| Faster Testing | Slower Testing |
| Strategy Validation | Real-Time Validation |
Both methods are important.
Advantages of Backtesting
Confidence Building
Reduces uncertainty before trading real money.
Risk Analysis
Identifies potential losses.
Performance Evaluation
Measures profitability and consistency.
Strategy Improvement
Allows adjustments before live trading.
Limitations of Backtesting
Past Results Do Not Guarantee Future Performance
Markets constantly change.
Historical Data Quality
Poor data produces inaccurate results.
Human Bias
Manual testing can be influenced by emotions.
Slippage and Execution Differences
Live markets may behave differently.
Best Practices for Backtesting
- Use clear rules
- Test large sample sizes
- Include trading costs
- Avoid over-optimization
- Test different market conditions
- Maintain a trading journal
- Follow strict risk management
Sample Backtesting Checklist
Before trading a strategy, ensure:
✔ Minimum 100 trades tested
✔ Positive profit factor
✔ Acceptable drawdown
✔ Favorable risk-reward ratio
✔ Consistent performance
✔ Successful forward testing
Can Backtesting Guarantee Profits?
No.
Backtesting cannot guarantee future profits.
It only helps traders:
- Improve confidence
- Validate strategies
- Understand risks
Successful trading still requires:
- Discipline
- Risk management
- Emotional control
- Continuous learning
How Beginners Should Start Backtesting
Step 1
Choose one simple strategy.
Step 2
Test at least 100 trades.
Step 3
Record all results.
Step 4
Analyze statistics.
Step 5
Forward test using a demo account.
Step 6
Move to small real-money positions.
Backtesting is one of the most valuable skills a trader can develop. It allows traders to evaluate strategies using historical data before risking real capital. By understanding win rates, drawdowns, risk-reward ratios, and profitability, traders can make more informed decisions and avoid costly mistakes.
While backtesting cannot predict the future, it significantly improves preparation, confidence, and consistency. When combined with proper risk management and forward testing, backtesting becomes a powerful tool for long-term trading success.
Frequently Asked Questions (FAQs)
1. What is backtesting in trading?
Backtesting is the process of testing a trading strategy using historical market data.
2. Why is backtesting important?
It helps evaluate profitability, risk, and consistency before trading live.
3. How many trades should I backtest?
Most traders recommend testing at least 100 trades.
4. Can backtesting guarantee future profits?
No, past performance does not guarantee future results.
5. What is a good win rate?
A profitable strategy can have various win rates depending on risk-reward ratio.
6. What is forward testing?
Forward testing applies a strategy in real-time using a demo account.
7. Which platform is best for backtesting?
TradingView and MetaTrader are popular choices.
8. Should beginners backtest manually?
Yes, manual backtesting helps improve chart-reading skills.
9. What is curve fitting?
Curve fitting occurs when a strategy is over-optimized for historical data.
10. Is backtesting necessary for every strategy?
Yes, every strategy should be tested before risking real money.