The Symmetrical Triangle is a neutral chart pattern that signals a potential breakout in either direction. It forms during market consolidation when neither buyers nor sellers have full control, leading to a period of tightening price action before a strong move.
🔍 What is a Symmetrical Triangle?
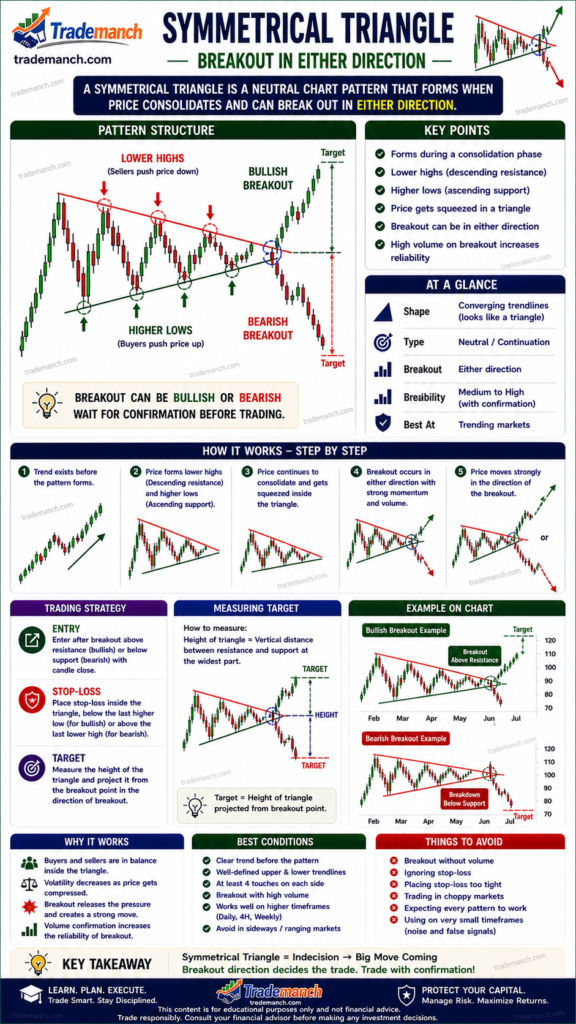
A Symmetrical Triangle is created when:
- Price forms lower highs (descending resistance)
- Price forms higher lows (ascending support)
This results in two converging trendlines, forming a triangle shape that reflects market indecision.
📈 Structure of Symmetrical Triangle
The pattern has three main components:
- Descending Resistance Line: Sellers push prices lower each time
- Ascending Support Line: Buyers push prices higher on dips
- Breakout: Price eventually breaks out above resistance or below support
🧠 Market Psychology
- Buyers and sellers are in balance ⚖️
- Volatility decreases as price compresses
- Pressure builds → leads to a sharp breakout
The direction of breakout determines whether the move will be bullish or bearish.
🚀 How to Trade Symmetrical Triangle
✅ Entry Point
- Enter after confirmed breakout (either upside or downside)
- Confirm with strong volume
🛑 Stop Loss
- For bullish breakout: below support trendline
- For bearish breakout: above resistance trendline
🎯 Target Price
- Measure the height of the triangle
- Apply it in the direction of the breakout
📊 Key Characteristics
- Converging trendlines (triangle shape)
- At least 2–3 touches on both sides
- Volume decreases during formation
- Volume increases during breakout
- Can appear in both continuation and reversal scenarios
⚠️ Important Tips
- Wait for clear breakout confirmation
- Avoid entering trades inside the triangle
- Fake breakouts are common → use volume & indicators
- Works well on all timeframes