
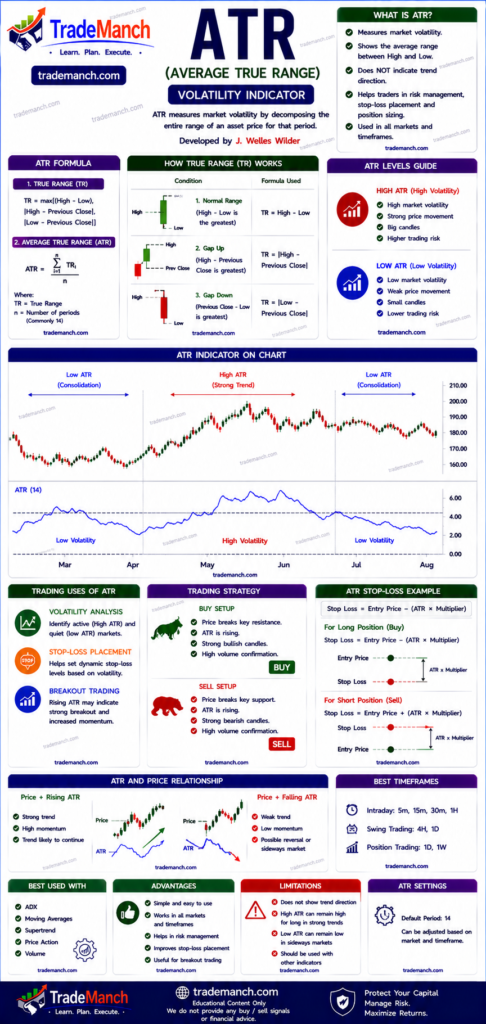
The ATR (Average True Range) is one of the most important volatility indicators in technical analysis. Unlike indicators such as RSI or MACD, ATR does not tell traders whether the market is bullish or bearish. Instead, it measures:
Position sizing
Market volatility
Price movement strength
Risk levels
Stop-loss placement
ATR is widely used by:
- Intraday traders
- Swing traders
- Options traders
- Forex traders
- Cryptocurrency traders
- Professional fund managers
This complete guide explains everything about ATR, including formula, calculation, trading strategies, advantages, limitations, and risk management techniques.
What Is ATR (Average True Range)?
ATR stands for:
- Average True Range
It was developed by:
- J. Welles Wilder Jr.
ATR measures:
- How much an asset typically moves during a specific period.
Simple Definition of ATR
ATR is a volatility indicator that measures the average price movement of a stock, commodity, forex pair, or cryptocurrency over a given period.
Why ATR Is Important
ATR helps traders:
- Measure market volatility
- Set proper stop losses
- Determine position size
- Avoid premature exits
- Manage risk effectively
What Does ATR Measure?
ATR measures:
- Volatility
It does NOT measure:
- Trend direction
- Buy signals
- Sell signals
ATR only tells:
- How much price is moving.
Understanding Volatility
Volatility refers to:
- The speed and magnitude of price movement.
High Volatility
When ATR rises:
- Price swings become larger
- Risk increases
- Trading opportunities increase
Low Volatility
When ATR falls:
- Price movement becomes smaller
- Market becomes quieter
- Breakouts may be approaching
ATR Formula
ATR calculation starts with True Range (TR).
True Range Formula
TR=max[(High−Low),∣High−PreviousClose∣,∣Low−PreviousClose∣]
ATR Calculation
ATR is calculated as the average of True Range values.
ATR=n∑TR
Where:
- TR = True Range
- n = Number of periods
Standard ATR Settings
Most traders use:
- ATR 14
This means:
- ATR is calculated using the last 14 periods.
How to Read ATR
Suppose:
- Stock price = ₹500
- ATR = ₹10
This means:
- The stock typically moves about ₹10 per period.
ATR Interpretation
Rising ATR
Indicates:
- Increasing volatility
- Stronger market movement
Falling ATR
Indicates:
- Decreasing volatility
- Consolidation phase
ATR and Market Volatility
| ATR Value | Meaning |
|---|---|
| High ATR | High volatility |
| Low ATR | Low volatility |
| Rising ATR | Increasing activity |
| Falling ATR | Decreasing activity |
ATR in Intraday Trading
Intraday traders use ATR for:
- Stop-loss placement
- Target calculation
- Volatility assessment
Popular charts:
- 5-minute chart
- 15-minute chart
ATR in Swing Trading
Swing traders use ATR to:
- Hold trades longer
- Set wider stop losses
- Measure trend volatility
Popular charts:
- 1-hour chart
- Daily chart
ATR Trading Strategies
1. ATR Stop Loss Strategy
One of the most popular ATR uses.
Buy Trade Example
Suppose:
- Entry = ₹100
- ATR = ₹5
Stop loss:
100−5=95
Stop-loss = ₹95
2. ATR Multiple Stop Loss Method
Professional traders often use:
- 1.5 ATR
- 2 ATR
Example:
Entry = ₹100
ATR = ₹5
2 ATR Stop Loss:
100−(2×5)=90
Stop-loss = ₹90
3. ATR Position Sizing Strategy
ATR helps determine:
- Trade quantity
Higher ATR:
- Smaller position size
Lower ATR:
- Larger position size
This keeps risk consistent.
4. ATR Breakout Strategy
When ATR increases suddenly:
- Market volatility rises
- Breakout probability increases
Traders look for:
- Strong volume
- Price breakout
ATR and Risk Management
ATR is one of the best tools for risk management.
It helps:
- Control losses
- Avoid emotional decisions
- Standardize trading risk
ATR and Stop Loss Placement
Without ATR:
- Stop losses may be too tight
With ATR:
- Stops adapt to market volatility
This reduces:
- False stop-loss hits
ATR and Profit Targets
Some traders use ATR for target setting.
Example:
Entry = ₹500
ATR = ₹20
Target:
500+(2×20)=540
Potential target = ₹540
ATR + Supertrend Strategy
The Supertrend indicator is based on ATR.
Popular setup:
- Supertrend Buy Signal
- Rising ATR
This confirms:
- Strong momentum
ATR + RSI Strategy
Combination:
- RSI measures momentum
- ATR measures volatility
Bullish Setup
- RSI above 50
- ATR rising
Indicates:
- Strong bullish momentum
ATR + MACD Strategy
Combination:
- MACD confirms trend
- ATR confirms volatility
This improves:
- Trade quality
Advantages of ATR
Excellent Volatility Indicator
Provides accurate volatility measurement.
Great Risk Management Tool
Helps place logical stop losses.
Useful Across Markets
Works in:
- Stocks
- Forex
- Crypto
- Commodities
Beginner Friendly
Easy to understand and apply.
Limitations of ATR
No Trend Direction
ATR does not indicate:
- Bullish trend
- Bearish trend
No Entry Signal
ATR does not tell traders:
- When to buy
- When to sell
Must Be Combined With Other Indicators
Use ATR with:
- RSI
- MACD
- Supertrend
- Price Action
Common Beginner Mistakes With ATR
Using ATR as Buy Signal
ATR only measures volatility.
Ignoring Trend Direction
Always analyze trend separately.
Using Fixed Stop Loss
ATR-based stop losses adapt better to market conditions.
Trading High ATR Stocks Without Risk Control
High volatility increases risk.
ATR vs RSI
| ATR | RSI |
|---|---|
| Measures volatility | Measures momentum |
| No buy/sell signal | Buy/sell signals possible |
| Risk management tool | Trading indicator |
ATR vs MACD
| ATR | MACD |
|---|---|
| Volatility indicator | Trend indicator |
| Risk management | Trend analysis |
| No directional bias | Shows bullish/bearish trend |
ATR vs Bollinger Bands
| ATR | Bollinger Bands |
|---|---|
| Pure volatility measurement | Volatility + price levels |
| Numerical value | Visual bands |
| Better for stop-loss setting | Better for breakout analysis |
ATR in Cryptocurrency Trading
ATR is widely used in:
- Bitcoin
- Ethereum
because crypto markets experience:
- High volatility
- Large price swings
ATR in Indian Stock Market
Popular stocks where ATR is useful:
- Reliance Industries
- Infosys
- HDFC Bank
These stocks often show:
- Consistent volatility patterns
Best Timeframes for ATR
| Trading Style | Timeframe |
|---|---|
| Scalping | 1-min / 5-min |
| Intraday Trading | 5-min / 15-min |
| Swing Trading | 1-hour / Daily |
| Positional Trading | Daily / Weekly |
Can ATR Guarantee Profits?
No.
ATR cannot guarantee profits.
It only helps traders:
- Measure volatility
- Manage risk
- Place better stop losses
Successful trading still requires:
- Strategy
- Discipline
- Patience
- Emotional control
How Beginners Should Learn ATR
Step 1: Understand Volatility
Learn how markets expand and contract.
Step 2: Practice ATR Stop Loss Placement
Study ATR behavior on charts.
Step 3: Combine ATR With Trend Indicators
Use:
- RSI
- MACD
- Supertrend
Step 4: Use Demo Trading
Practice before risking real money.
ATR (Average True Range) is one of the most valuable indicators for measuring market volatility and managing risk. While it does not provide buy or sell signals, it helps traders:
- Place better stop losses
- Set realistic targets
- Determine position size
- Understand market conditions
Professional traders often consider ATR an essential risk management tool. When combined with indicators like RSI, MACD, and Supertrend, ATR can significantly improve trading decisions and overall consistency.
Frequently Asked Questions (FAQs)
1. What is ATR in trading?
ATR stands for Average True Range and measures market volatility.
2. Who created ATR?
ATR was developed by J. Welles Wilder Jr..
3. Does ATR show buy and sell signals?
No, ATR only measures volatility.
4. What is the best ATR setting?
Most traders use ATR 14.
5. Is ATR useful for intraday trading?
Yes, it is widely used for stop-loss placement and risk management.
6. What does a rising ATR mean?
It indicates increasing market volatility.
7. What does a falling ATR mean?
It indicates decreasing volatility and possible consolidation.
8. Can ATR be used in crypto trading?
Yes, ATR is popular in cryptocurrency markets.
9. Which indicators work best with ATR?
RSI, MACD, Supertrend, and Price Action.
10. Can ATR guarantee profits?
No, ATR helps manage risk but cannot guarantee profitable trades.