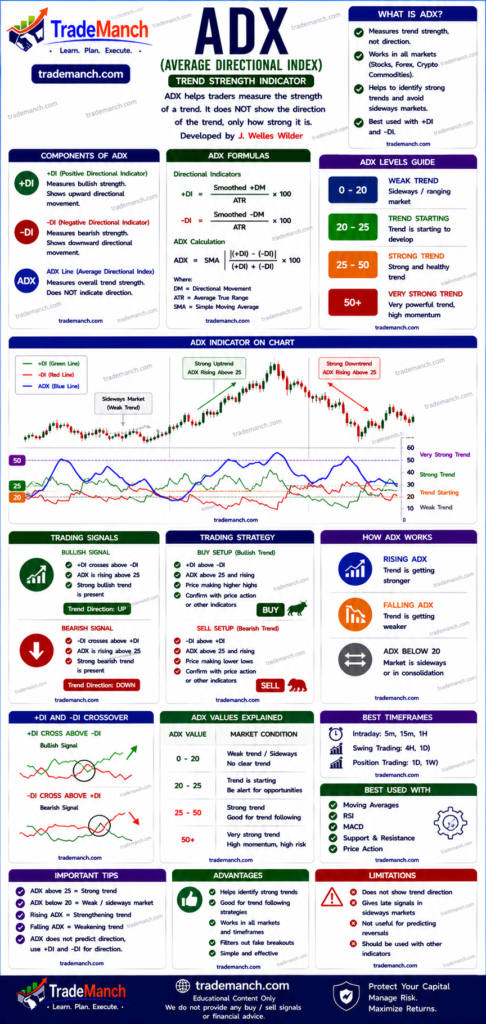
The ADX (Average Directional Index) is one of the most powerful trend-strength indicators used in technical analysis. Unlike indicators such as RSI, MACD, or Stochastic, ADX does not tell traders whether the market is bullish or bearish. Instead, it measures:
- Trend strength
- Momentum strength
- Market conditions
- Breakout potential
- Trend continuation probability
ADX is widely used by:
- Intraday traders
- Swing traders
- Forex traders
- Cryptocurrency traders
- Professional investors
This complete beginner-friendly guide explains everything about ADX, including formulas, calculations, strategies, advantages, limitations, and practical trading applications.
What Is ADX?
ADX stands for:
- Average Directional Index
It was developed by:
- J. Welles Wilder Jr.
ADX helps traders determine:
- Whether a trend exists
- How strong the trend is
Simple Definition of ADX
ADX is a technical indicator that measures the strength of a market trend regardless of whether the trend is upward or downward.
Why ADX Is Important
Many indicators generate signals during:
- Trending markets
- Sideways markets
ADX helps traders identify:
- Strong trends
- Weak trends
- Trending conditions
- Range-bound conditions
This helps avoid low-probability trades.
Components of ADX
The ADX system contains:
1. ADX Line
Measures:
- Trend strength
2. +DI (Positive Directional Indicator)
Measures:
- Bullish strength
3. -DI (Negative Directional Indicator)
Measures:
- Bearish strength
How ADX Works
ADX itself measures:
- Strength only
It does NOT measure:
- Trend direction
Trend direction comes from:
- +DI
- -DI
Understanding ADX Values
| ADX Value | Market Condition |
|---|---|
| Below 20 | Weak Trend |
| 20–25 | Trend Beginning |
| 25–50 | Strong Trend |
| 50–75 | Very Strong Trend |
| Above 75 | Extremely Strong Trend |
ADX Below 20
Indicates:
- Sideways market
- Weak trend
- Low momentum
Most trend-following strategies perform poorly here.
ADX Above 25
Indicates:
- Strong trend developing
Many professional traders prefer:
- Trading only when ADX > 25
ADX Above 50
Indicates:
- Very strong trend
Often seen during:
- Breakouts
- Major market moves
Understanding +DI and -DI
+DI Above -DI
Indicates:
- Bullish trend dominance
Buyers are stronger than sellers.
-DI Above +DI
Indicates:
- Bearish trend dominance
Sellers are stronger than buyers.
Buy Signal Using ADX
Bullish setup:
- +DI crosses above -DI
- ADX above 25
This indicates:
- Strong bullish trend
Sell Signal Using ADX
Bearish setup:
- -DI crosses above +DI
- ADX above 25
This indicates:
- Strong bearish trend
ADX Formula
ADX calculation involves:
- True Range (TR)
- Positive Directional Movement (+DM)
- Negative Directional Movement (-DM)
The complete calculation is complex, and trading platforms calculate it automatically.
The main concept:
ADX=Average of Directional Movement Strength
Standard ADX Setting
Most traders use:
- ADX 14
This is the default setting on most platforms.
ADX Trading Strategies
1. ADX Trend Strength Strategy
Buy Setup
- ADX above 25
- +DI above -DI
Indicates:
- Strong uptrend
Sell Setup
- ADX above 25
- -DI above +DI
Indicates:
- Strong downtrend
2. ADX Breakout Strategy
Before major breakouts:
- ADX often remains low
After breakout:
- ADX rises sharply
This confirms:
- Strong momentum
Example
Suppose:
- Stock breaks resistance
- ADX rises from 18 to 30
Possible interpretation:
- Breakout gaining strength
3. ADX + RSI Strategy
Popular combination:
- ADX measures trend strength
- RSI measures momentum
Buy Example
- ADX above 25
- RSI above 50
Indicates:
- Strong bullish momentum
Sell Example
- ADX above 25
- RSI below 50
Indicates:
- Strong bearish momentum
4. ADX + MACD Strategy
Combination:
- MACD identifies trend
- ADX confirms trend strength
This improves:
- Signal quality
ADX in Intraday Trading
Intraday traders use ADX to:
- Avoid sideways markets
- Identify strong trends
- Filter false signals
Popular charts:
- 5-minute
- 15-minute
ADX in Swing Trading
Swing traders use:
- 1-hour chart
- Daily chart
to identify:
- Sustainable trends
- Strong momentum
ADX in Forex Trading
ADX is extremely popular in forex because:
- Currency pairs often trend strongly
ADX helps identify:
- Trend quality
ADX in Cryptocurrency Trading
Crypto traders use ADX for:
- Bitcoin
- Ethereum
because cryptocurrencies frequently experience:
- Strong directional moves
ADX in Indian Stock Market
Popular stocks where ADX is useful:
- Reliance Industries
- Infosys
- HDFC Bank
These stocks often display:
- Strong trends
- Consistent momentum
Advantages of ADX
Measures Trend Strength
One of the best trend-strength indicators available.
Filters Sideways Markets
Helps avoid low-quality trades.
Works Across Markets
Useful in:
- Stocks
- Forex
- Crypto
- Commodities
Beginner Friendly
Simple interpretation.
Limitations of ADX
Does Not Show Direction
ADX only shows:
- Trend strength
Not:
- Bullish direction
- Bearish direction
Lagging Indicator
Uses historical data.
Delayed Signals
Strong trends may already be underway when ADX rises.
Common Beginner Mistakes
Buying Because ADX Is High
High ADX means:
- Strong trend
Not necessarily:
- Buy signal
Ignoring +DI and -DI
Always analyze directional indicators.
Trading Low ADX Markets
ADX below 20 often indicates:
- Choppy conditions
Using ADX Alone
Combine with:
- RSI
- MACD
- Price Action
- Moving Averages
Best Indicators to Combine With ADX
Popular combinations:
- ADX + RSI
- ADX + MACD
- ADX + Supertrend
- ADX + Moving Average
- ADX + Price Action
ADX vs RSI
| ADX | RSI |
|---|---|
| Measures trend strength | Measures momentum |
| No overbought/oversold | Shows overbought/oversold |
| Trend filter | Entry timing tool |
ADX vs MACD
| ADX | MACD |
|---|---|
| Trend strength | Trend direction |
| No directional bias | Directional indicator |
| Confirmation tool | Signal generator |
ADX vs ATR
| ADX | ATR |
|---|---|
| Measures trend strength | Measures volatility |
| Trend analysis | Risk management |
| Directional movement based | Price range based |
Best Timeframes for ADX
| Trading Style | Timeframe |
|---|---|
| Scalping | 1-min / 5-min |
| Intraday Trading | 5-min / 15-min |
| Swing Trading | 1-hour / Daily |
| Positional Trading | Daily / Weekly |
Risk Management While Using ADX
Always use:
- Stop loss
- Position sizing
- Risk-reward ratio
Example of Risk-Reward Ratio
Suppose:
- Risk = ₹20
- Target = ₹60
Risk-reward ratio:
2060=3:1
Can ADX Guarantee Profits?
No.
ADX only helps traders:
- Measure trend strength
- Avoid weak trends
- Improve trade quality
Successful trading still requires:
- Discipline
- Strategy
- Patience
- Risk management
How Beginners Should Learn ADX
Step 1: Understand Trend Strength
Learn the difference between:
- Strong trends
- Weak trends
Step 2: Study +DI and -DI
Understand trend direction.
Step 3: Practice Chart Analysis
Observe ADX behavior in different market conditions.
Step 4: Combine With Other Indicators
Never rely solely on ADX.
ADX (Average Directional Index) is one of the most valuable indicators for measuring trend strength. It helps traders identify whether a market is trending strongly or moving sideways.
When combined with indicators such as:
- RSI
- MACD
- Supertrend
- Moving Averages
ADX can significantly improve trading decisions by filtering weak setups and focusing on high-probability opportunities.
For beginners and professionals alike, ADX remains one of the most effective tools for trend analysis and market assessment.
Frequently Asked Questions (FAQs)
1. What is ADX in trading?
ADX is a trend-strength indicator used to measure the strength of market trends.
2. Who created ADX?
ADX was developed by J. Welles Wilder Jr..
3. What does ADX above 25 mean?
It generally indicates a strong trend.
4. What does ADX below 20 mean?
It often indicates a weak or sideways market.
5. Does ADX show trend direction?
No, ADX measures strength only. Direction comes from +DI and -DI.
6. What is the best ADX setting?
Most traders use ADX 14.
7. Is ADX useful for intraday trading?
Yes, it helps identify strong trending conditions.
8. Which indicators work best with ADX?
RSI, MACD, Supertrend, and Moving Averages.
9. Can ADX be used in crypto trading?
Yes, it is widely used in cryptocurrency markets.
10. Can ADX guarantee profits?
No, it improves analysis but cannot guarantee profitable trades.