
The Supertrend Indicator is one of the most popular trend-following indicators used by traders in:
- Stock market trading
- Intraday trading
- Swing trading
- Forex trading
- Cryptocurrency trading
The Supertrend indicator helps traders identify:
- Market trend direction
- Buy and sell signals
- Trend reversals
- Entry and exit opportunities
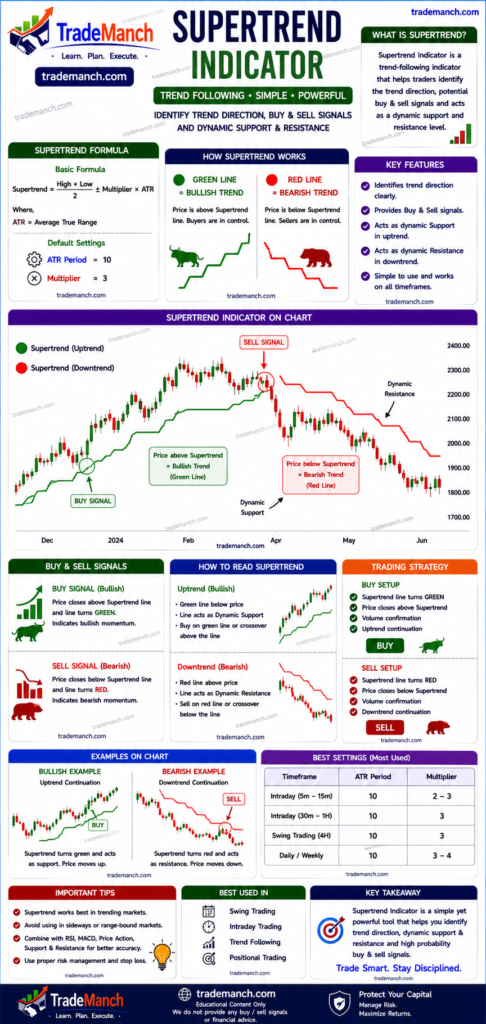
This complete guide explains everything about the Supertrend Indicator, including formula, settings, strategies, advantages, limitations, and professional trading usage.
What Is Supertrend Indicator?
The Supertrend Indicator is a trend-following technical indicator that uses:
- ATR (Average True Range)
- Price movement
to identify market direction and generate trading signals.
Simple Definition of Supertrend
Supertrend is a technical indicator that shows whether the market trend is bullish or bearish.
Who Created the Supertrend Indicator?
The Supertrend Indicator was developed by:
- Olivier Seban
How Supertrend Works
Supertrend changes color and position based on trend direction.
Bullish Trend
When Supertrend moves below price:
- Market is considered bullish.
Usually shown as:
- Green line
Bearish Trend
When Supertrend moves above price:
- Market is considered bearish.
Usually shown as:
- Red line
Supertrend Formula
The Supertrend Indicator is based on:
- ATR (Average True Range)
Basic formula:
Supertrend=2High+Low±(Multiplier×ATR)
What Is ATR?
ATR stands for:
- Average True Range
ATR measures:
- Market volatility
Higher ATR:
- Higher volatility
Lower ATR:
- Lower volatility
Default Supertrend Settings
Most traders use:
- ATR Period = 10
- Multiplier = 3
This is the most commonly used setting.
Understanding Supertrend Signals
Buy Signal
A buy signal occurs when:
- Supertrend changes from red to green
- Price closes above Supertrend line
This indicates:
- Bullish trend
Sell Signal
A sell signal occurs when:
- Supertrend changes from green to red
- Price closes below Supertrend line
This indicates:
- Bearish trend
Example of Supertrend Buy Signal
Suppose:
- Price crosses above Supertrend line
- Indicator turns green
This may indicate:
- Uptrend beginning
Example of Supertrend Sell Signal
Suppose:
- Price falls below Supertrend line
- Indicator turns red
This may indicate:
- Downtrend beginning
Why Supertrend Is Popular
Supertrend is popular because:
- Simple to use
- Easy visual signals
- Good for trend trading
- Beginner-friendly
Supertrend in Intraday Trading
Intraday traders use Supertrend for:
- Trend confirmation
- Scalping
- Momentum trading
Popular chart timeframes:
- 5-minute chart
- 15-minute chart
Supertrend in Swing Trading
Swing traders use:
- 1-hour chart
- 4-hour chart
- Daily chart
to identify:
- Medium-term trends
- Swing opportunities
Best Timeframes for Supertrend
| Trading Style | Timeframe |
|---|---|
| Scalping | 1-min / 5-min |
| Intraday Trading | 5-min / 15-min |
| Swing Trading | 1-hour / Daily |
| Positional Trading | Daily / Weekly |
Supertrend Trading Strategies
1. Basic Supertrend Strategy
Buy Setup
- Price above Supertrend
- Supertrend turns green
Sell Setup
- Price below Supertrend
- Supertrend turns red
2. Supertrend + Moving Average Strategy
Many traders combine:
- Supertrend
- 200 EMA or 50 EMA
Bullish Setup
- Price above 200 EMA
- Supertrend bullish
This confirms:
- Strong uptrend
3. Supertrend + RSI Strategy
Popular combination:
- Supertrend confirms trend
- RSI confirms momentum
Buy Example
- Supertrend bullish
- RSI above 50
4. Multi-Timeframe Supertrend Strategy
Traders analyze:
- Higher timeframe trend
- Lower timeframe entry
Example:
- Daily trend bullish
- 15-minute Supertrend buy signal
Advantages of Supertrend Indicator
Easy to Understand
Very beginner-friendly.
Clear Buy/Sell Signals
Simple visual signals.
Trend Identification
Excellent for trending markets.
Useful in Multiple Markets
Works in:
- Stocks
- Forex
- Crypto
- Commodities
Limitations of Supertrend Indicator
False Signals in Sideways Market
Supertrend performs poorly during:
- Consolidation
- Choppy markets
Lagging Indicator
Like most indicators:
- Supertrend uses past price data
Not Accurate Alone
Should be combined with:
- Trend analysis
- Support/resistance
- Risk management
Common Beginner Mistakes With Supertrend
Trading Every Signal
Not all signals are reliable.
Ignoring Market Trend
Always trade with overall trend direction.
Using Supertrend Alone
Combine with:
- RSI
- Volume
- Price action
Ignoring Stop Loss
Risk management remains essential.
Best Indicators to Combine With Supertrend
Popular combinations:
- Supertrend + RSI
- Supertrend + MACD
- Supertrend + Moving Average
- Supertrend + Volume Analysis
Supertrend vs Moving Average
| Supertrend | Moving Average |
|---|---|
| Dynamic trend indicator | Simple trend-following |
| Gives direct buy/sell signals | Mainly shows direction |
| Faster trend shifts | Slower reaction |
Supertrend vs RSI
| Supertrend | RSI |
|---|---|
| Trend-following indicator | Momentum indicator |
| Shows trend direction | Shows overbought/oversold |
| Best in trending market | Best for momentum analysis |
Many traders combine both indicators.
Supertrend in Cryptocurrency Trading
Supertrend is widely used in crypto trading because of strong trends.
Popular cryptocurrencies:
- Bitcoin
- Ethereum
Supertrend in Indian Stock Market
Popular Indian stocks for Supertrend trading:
- Reliance Industries
- Infosys
- HDFC Bank
These stocks offer:
- High liquidity
- Strong trends
- Better price movement
Best Market Conditions for Supertrend
Supertrend works best in:
- Trending markets
- Strong momentum conditions
It performs poorly during:
- Sideways consolidation
Risk Management While Using Supertrend
Always use:
- Stop loss
- Position sizing
- Risk-reward ratio
Example of Risk-Reward Ratio
Suppose:
- Risk = ₹15
- Target = ₹45
Risk-reward ratio:
1545=3:1
Can Supertrend Guarantee Profits?
No indicator guarantees profits.
Supertrend only improves:
- Trend identification
- Trade probability
- Market analysis
Successful trading still requires:
- Discipline
- Experience
- Emotional control
- Risk management
How Beginners Should Learn Supertrend
Step 1: Learn Trend Basics
Understand:
- Uptrend
- Downtrend
- Market structure
Step 2: Practice on Charts
Analyze historical Supertrend signals.
Step 3: Combine With Other Indicators
Avoid isolated signals.
Step 4: Use Demo Trading
Practice before risking real money.
Best Settings for Beginners
Beginners usually prefer:
- ATR = 10
- Multiplier = 3
These settings provide balanced signals.
Conclusion
The Supertrend Indicator is one of the most effective and beginner-friendly trend-following indicators in technical analysis. It helps traders identify:
- Market trends
- Buy and sell opportunities
- Trend reversals
Its simple visual structure makes it popular among intraday traders, swing traders, and investors.
However, Supertrend should not be used alone. Successful traders combine it with:
- RSI
- MACD
- Price action
- Support and resistance
- Risk management
With practice and discipline, Supertrend can become a powerful tool for identifying trends and improving trading decisions.
Frequently Asked Questions (FAQs)
1. What is Supertrend Indicator?
Supertrend is a trend-following indicator based on ATR and price movement.
2. Who created Supertrend?
It was developed by Olivier Seban.
3. What is the default Supertrend setting?
Most traders use ATR 10 and multiplier 3.
4. Is Supertrend good for beginners?
Yes, it is very beginner-friendly.
5. Does Supertrend work in intraday trading?
Yes, it is widely used for intraday trading.
6. What is ATR in Supertrend?
ATR measures market volatility.
7. Can Supertrend be used in crypto trading?
Yes, it works well in crypto markets.
8. Is Supertrend accurate?
It improves probability but does not guarantee profits.
9. Which indicators work best with Supertrend?
RSI, MACD, and moving averages are commonly combined.
10. Can Supertrend be used alone?
No, it works better with risk management and additional confirmation tools.