The Rounding Top (also called a Saucer Top) is a long-term bearish reversal chart pattern that signals a gradual shift from an uptrend to a downtrend. It reflects a slow transition in market sentiment from bullish to bearish.
🔍 What is a Rounding Top?
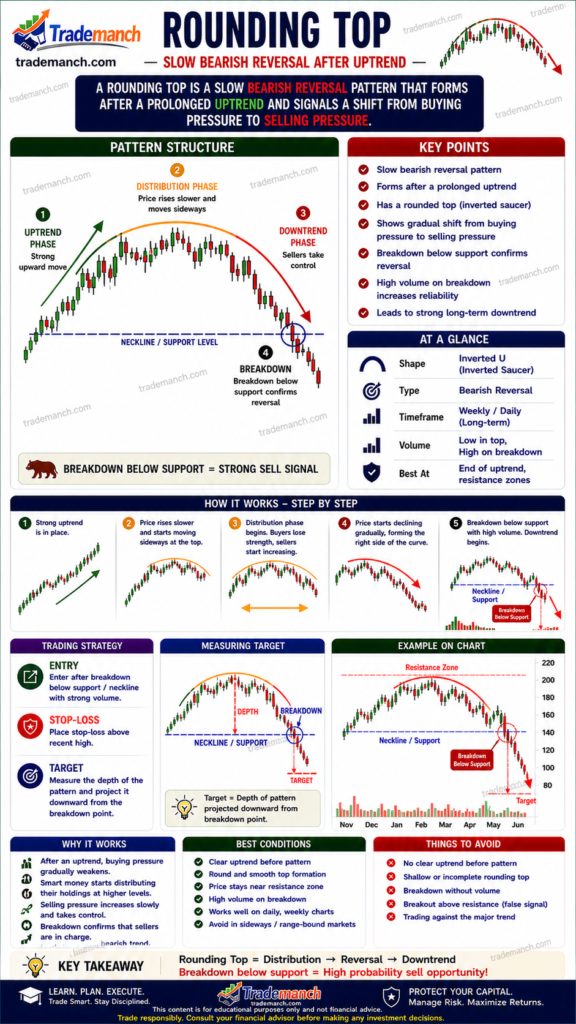
A Rounding Top forms when the price creates a smooth, curved structure that looks like an inverted “U” shape. Unlike sharp reversals, this pattern develops over time and indicates distribution before a downward move.
📈 Structure of Rounding Top
- Uptrend Phase: Price rises steadily
- Peak Formation: Momentum slows and price flattens
- Distribution Phase: Sellers begin to dominate gradually
- Decline Phase: Price starts falling
- Breakdown: Price breaks below support, confirming bearish reversal
🧠 Market Psychology
- Buyers dominate initially and push prices higher ✅
- Momentum weakens near the top
- Sellers slowly enter the market (distribution) ❌
- Supply increases → leads to a gradual downward trend
This pattern shows a transition from confidence to caution among traders.
🚀 How to Trade Rounding Top
✅ Entry Point
- Enter after breakdown below support with volume confirmation
🛑 Stop Loss
- Place stop loss above the recent swing high
🎯 Target Price
- Measure the height of the pattern (Top – Support)
- Subtract it from the breakdown level
📊 Key Characteristics
- Smooth inverted U-shaped curve
- Forms over a long period (weeks to months)
- Volume decreases near the peak
- Volume increases during breakdown
- No sharp spikes—gradual transition
⚠️ Important Tips
- Best suited for positional and long-term trading
- Avoid confusing with short-term tops
- Wait for clear breakdown confirmation
- Use indicators like RSI, MACD, Moving Averages
- Works best on daily and weekly charts