
Candlestick patterns are among the most powerful tools in technical analysis. They help traders understand market psychology, identify potential trend reversals, and make better trading decisions.
Among hundreds of candlestick patterns, Doji, Hammer, and Engulfing Patterns are some of the most popular and widely used by traders worldwide. These patterns can provide valuable clues about buyer and seller behavior in the market
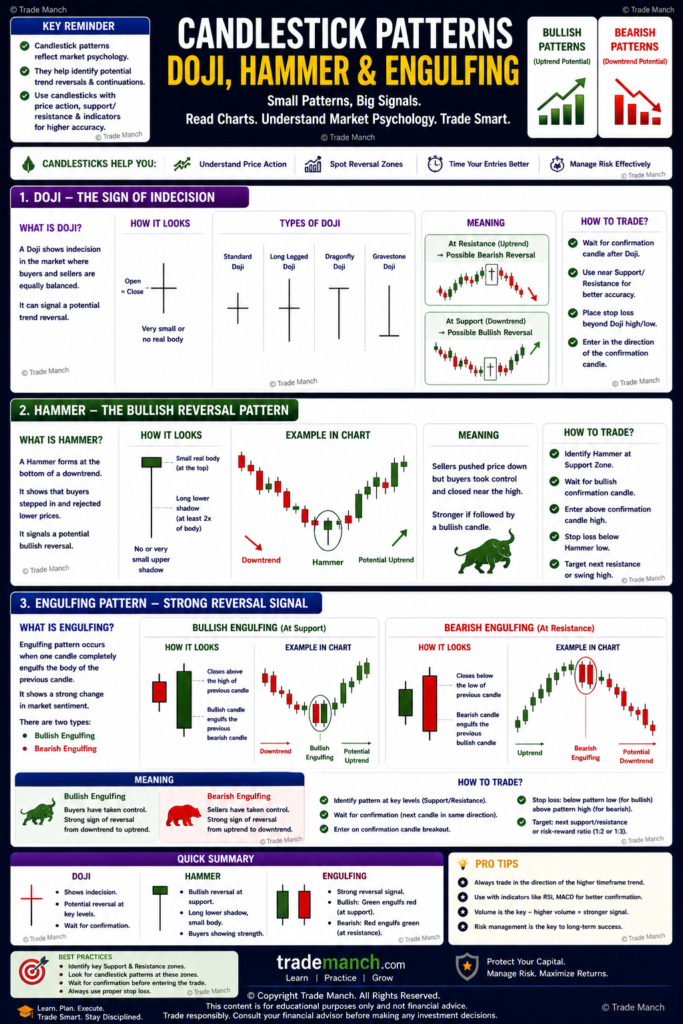
This guide explains these candlestick patterns in simple language with practical examples.
What Are Candlestick Patterns?
Candlestick patterns are formations created by one or more candlesticks on a price chart.
They help traders analyze:
- Market sentiment
- Trend direction
- Potential reversals
- Entry opportunities
- Exit opportunities
Simple Definition of Candlestick Patterns
Candlestick patterns are visual signals on a chart that help traders understand the battle between buyers and sellers.
Why Candlestick Patterns Matter
Candlestick patterns help traders:
Identify Reversals
Spot potential trend changes.
Understand Market Psychology
Analyze buyer and seller strength.
Improve Trade Timing
Find better entry and exit points.
Support Technical Analysis
Work alongside support, resistance, and indicators.
Understanding Candlestick Structure
Every candlestick consists of:
Open Price
Starting price of the period.
High Price
Highest price reached.
Low Price
Lowest price reached.
Close Price
Ending price of the period.
Components of a Candlestick
Body
Represents the difference between open and close prices.
Upper Shadow (Wick)
Shows the highest price reached.
Lower Shadow (Wick)
Shows the lowest price reached.
Doji Candlestick Pattern
What Is a Doji?
A Doji forms when the opening and closing prices are nearly equal.
This creates a very small body.
Simple Definition of Doji
A Doji indicates indecision between buyers and sellers.
What Does a Doji Mean?
Neither buyers nor sellers are in control.
The market is uncertain.
Types of Doji
Standard Doji
Small body with upper and lower shadows.
Long-Legged Doji
Long shadows on both sides.
Indicates high volatility and indecision.
Dragonfly Doji
Long lower shadow.
Often signals potential bullish reversal.
Gravestone Doji
Long upper shadow.
Often signals potential bearish reversal.
Market Psychology Behind Doji
Buyers Push Up
But fail to maintain control.
Sellers Push Down
But also fail to dominate.
Result
Balance between bulls and bears.
When Doji Is Most Effective
At Support Levels
May signal bullish reversal.
At Resistance Levels
May signal bearish reversal.
After Strong Trends
Can indicate trend exhaustion.
Advantages of Doji
Easy to Identify
Simple chart pattern.
Works Across Markets
Useful in stocks, forex, commodities, and crypto.
Limitations of Doji
Requires Confirmation
A single Doji should not be traded alone.
Hammer Candlestick Pattern
What Is a Hammer?
A Hammer is a bullish reversal candlestick pattern.
Characteristics:
- Small body
- Long lower shadow
- Little or no upper shadow
Simple Definition of Hammer
A Hammer suggests buyers are regaining control after a decline.
Hammer Structure
Small Real Body
Near the top of the candle.
Long Lower Wick
Usually at least twice the body size.
Minimal Upper Shadow
Indicates strong buying recovery.
Market Psychology Behind Hammer
Sellers Initially Dominate
Prices fall sharply.
Buyers Step In
Strong buying pushes prices higher.
Result
Potential bullish reversal.
Where Does Hammer Work Best?
Downtrend
Most effective after a decline.
Support Levels
Strong reversal signal near support.
Hammer Example
Suppose:
- Stock falls from ₹500 to ₹470.
- Buyers push it back to ₹495.
A Hammer forms.
This suggests buyer strength.
Advantages of Hammer
Strong Reversal Signal
Can identify potential bottoms.
Easy to Spot
Simple structure.
Limitations of Hammer
Needs Confirmation
Wait for the next bullish candle.
Bullish Engulfing Pattern
What Is a Bullish Engulfing Pattern?
A Bullish Engulfing pattern consists of:
First Candle
Small bearish candle.
Second Candle
Large bullish candle.
The second candle completely engulfs the first candle’s body.
Simple Definition
A Bullish Engulfing pattern signals a possible upward reversal.
Market Psychology
Sellers Initially Control
First candle is bearish.
Buyers Take Over
Second candle completely overwhelms sellers.
Result
Potential trend reversal.
Best Location
Downtrend
Most effective after a decline.
Support Zone
Stronger signal near support.
Example
Day 1:
Bearish candle.
Day 2:
Large bullish candle engulfs Day 1.
This indicates strong buying pressure.
Bearish Engulfing Pattern
What Is a Bearish Engulfing Pattern?
A Bearish Engulfing pattern consists of:
First Candle
Small bullish candle.
Second Candle
Large bearish candle.
The bearish candle completely engulfs the bullish candle.
Simple Definition
A Bearish Engulfing pattern signals a possible downward reversal.
Market Psychology
Buyers Initially Control
First candle is bullish.
Sellers Take Over
Second candle overwhelms buyers.
Result
Potential bearish reversal.
Best Location
Uptrend
Most effective after a rally.
Resistance Zone
Stronger bearish signal.
Hammer vs Doji vs Engulfing
| Pattern | Type | Signal |
|---|---|---|
| Doji | Indecision | Potential Reversal |
| Hammer | Bullish Reversal | Buying Strength |
| Bullish Engulfing | Bullish Reversal | Strong Buying |
| Bearish Engulfing | Bearish Reversal | Strong Selling |
Importance of Volume Confirmation
Volume strengthens candlestick signals.
High Volume
More reliable pattern.
Low Volume
Less reliable signal.
Importance of Support & Resistance
Candlestick patterns become more powerful when they appear near:
Support
Bullish patterns gain importance.
Resistance
Bearish patterns gain importance.
Combining Candlestick Patterns with Indicators
Many traders use:
RSI
Confirm momentum.
MACD
Confirm trend changes.
Moving Averages
Identify trend direction.
Common Beginner Mistakes
Trading Every Pattern
Not every pattern is worth trading.
Ignoring Trend Direction
Context matters.
Ignoring Volume
Volume confirms strength.
No Risk Management
Always use stop-loss.
Best Strategy for Beginners
Step 1
Identify trend.
Step 2
Mark support and resistance.
Step 3
Look for Doji, Hammer, or Engulfing patterns.
Step 4
Wait for confirmation.
Step 5
Use proper risk management.
Advantages of Candlestick Analysis
Easy to Learn
Visual and intuitive.
Works in All Markets
Stocks, forex, commodities, and crypto.
Helps Improve Timing
Supports entry and exit decisions.
Limitations of Candlestick Patterns
Not 100% Accurate
No pattern guarantees success.
Requires Context
Must be combined with other analysis methods.
Can Candlestick Patterns Predict the Market?
No.
Candlestick patterns provide clues about market sentiment and probabilities but cannot guarantee future price movements.
Successful traders combine candlestick analysis with:
- Trend analysis
- Support and resistance
- Volume analysis
- Risk management
Doji, Hammer, and Engulfing patterns are among the most important candlestick patterns every trader should learn. A Doji signals indecision, a Hammer suggests a potential bullish reversal, and Engulfing patterns indicate a shift in market control between buyers and sellers.
Understanding these patterns can improve market analysis and trade timing. However, they should never be used in isolation. Always combine candlestick patterns with support and resistance, volume, trend analysis, and proper risk management.
Remember: candlestick patterns provide probabilities—not guarantees.
Frequently Asked Questions (FAQs)
1. What is a Doji candlestick?
A Doji forms when the opening and closing prices are nearly equal, indicating market indecision between buyers and sellers.
2. What is a Hammer pattern?
A Hammer is a bullish reversal candlestick pattern characterized by a small body and a long lower shadow. It often appears after a downtrend.
3. What is a Bullish Engulfing pattern?
A Bullish Engulfing pattern occurs when a large bullish candle completely engulfs the body of a smaller bearish candle, signaling potential upward reversal.
4. What is a Bearish Engulfing pattern?
A Bearish Engulfing pattern occurs when a large bearish candle completely engulfs the body of a smaller bullish candle, indicating potential downward reversal.
5. Which candlestick pattern is best for beginners?
Doji, Hammer, and Engulfing patterns are among the easiest and most reliable candlestick patterns for beginners to learn.
6. Do candlestick patterns work in all markets?
Yes. Candlestick patterns can be used in stocks, forex, commodities, indices, and cryptocurrency markets.
7. Is a Hammer always a bullish signal?
Not always. A Hammer becomes more reliable when it appears at a support level and is confirmed by the next bullish candle.
8. Why is volume important when analyzing candlestick patterns?
Volume helps confirm the strength of a pattern. Higher volume generally increases the reliability of reversal signals.
9. Should I trade based on a single candlestick pattern?
No. Always combine candlestick patterns with trend analysis, support and resistance, volume, and risk management.
10. Can candlestick patterns guarantee profits?
No. Candlestick patterns indicate probabilities and market sentiment, but they cannot guarantee future price movements.