
Support and Resistance are among the most important concepts in Technical Analysis. Almost every successful trader uses these levels to identify potential buying opportunities, selling opportunities, entry points, stop-loss levels, and profit targets.
Whether you are an intraday trader, swing trader, positional trader, or long-term investor, understanding Support and Resistance can significantly improve your trading and investing decisions.
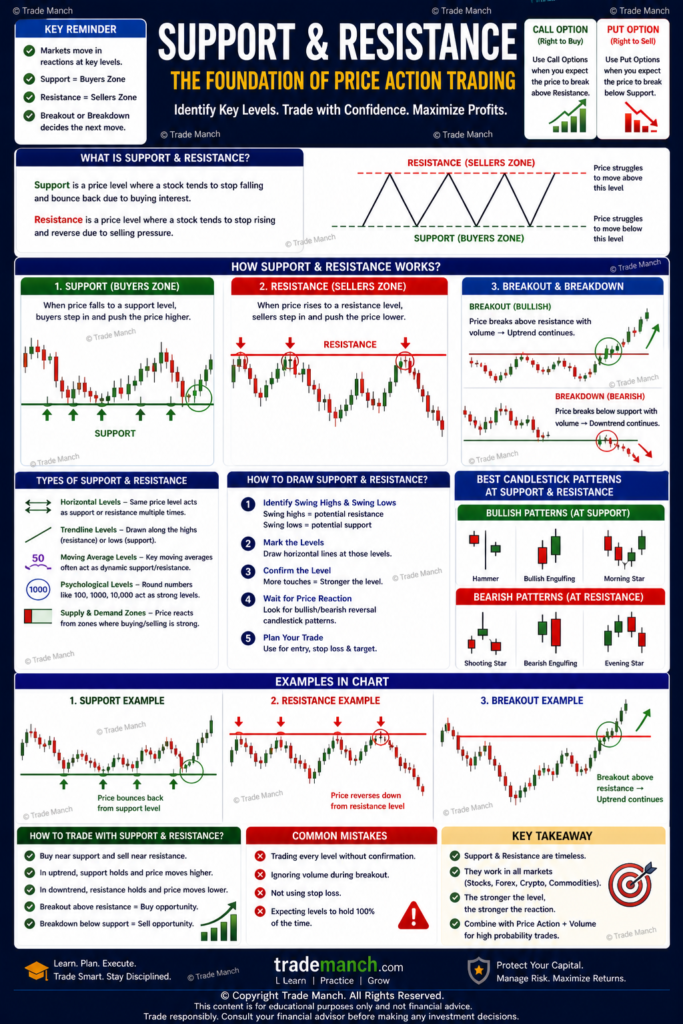
This guide explains Support and Resistance in simple language with practical examples.
What Is Support?
Support is a price level where a falling stock tends to stop declining because buying interest increases.
At support levels:
- Buyers become active.
- Demand increases.
- Selling pressure decreases.
As a result, the stock often bounces upward.
Simple Definition of Support
Support is a price level where demand is strong enough to prevent the stock from falling further.
Example of Support
Suppose a stock repeatedly falls near ₹500 and then starts rising.
This suggests:
Support Level = ₹500
Buyers are willing to purchase the stock around this price.
Why Support Forms
Support develops because traders and investors believe the stock is attractive at a particular price.
Reasons
Strong Demand
More buyers enter the market.
Value Buying
Investors see the stock as undervalued.
Psychological Levels
Round numbers often act as support.
Example:
- ₹100
- ₹500
- ₹1,000
What Is Resistance?
Resistance is a price level where a rising stock tends to stop increasing because selling pressure increases.
At resistance levels:
- Sellers become active.
- Supply increases.
- Buying momentum weakens.
As a result, the stock often moves downward.
Simple Definition of Resistance
Resistance is a price level where selling pressure prevents the stock from rising further.
Example of Resistance
Suppose a stock repeatedly rises to ₹700 and then falls.
This suggests:
Resistance Level = ₹700
Sellers are becoming active near that price.
Why Resistance Forms
Resistance develops because traders believe the stock has become expensive.
Reasons
Profit Booking
Investors sell to lock in gains.
Increased Supply
More sellers enter the market.
Psychological Levels
Round numbers often act as resistance.
Examples:
- ₹1,000
- ₹5,000
- ₹10,000
Understanding Market Psychology
Support and Resistance exist because of buyer and seller behavior.
At Support
Buyers Think
“This is a good price to buy.”
Sellers Think
“The stock may not fall much further.”
At Resistance
Buyers Think
“The stock is becoming expensive.”
Sellers Think
“This is a good level to sell.”
Types of Support and Resistance
Horizontal Support & Resistance
The most common type.
Price repeatedly reacts at a specific level.
Example
Support = ₹500
Resistance = ₹700
Trendline Support & Resistance
Created using trendlines.
Uptrend Support
A rising trendline acts as support.
Downtrend Resistance
A falling trendline acts as resistance.
Moving Average Support & Resistance
Popular moving averages often act as dynamic support and resistance.
Examples:
20 EMA
50 EMA
200 EMA
How to Identify Support and Resistance
Previous Swing Lows
Potential support zones.
Previous Swing Highs
Potential resistance zones.
Multiple Price Reactions
The more times price reacts, the stronger the level.
High Volume Areas
Often become important support or resistance zones.
Strong vs Weak Support
Strong Support
Characteristics:
- Multiple successful bounces
- High volume
- Long-term significance
Weak Support
Characteristics:
- Few price reactions
- Low trading activity
Strong vs Weak Resistance
Strong Resistance
Characteristics:
- Multiple rejections
- High selling volume
Weak Resistance
Characteristics:
- Limited price reactions
Support Becoming Resistance
A broken support level can become future resistance.
Example
Support:
₹500
Price breaks below ₹500.
Later, when price rises back toward ₹500:
₹500 may now act as resistance.
Resistance Becoming Support
A broken resistance level can become future support.
Example
Resistance:
₹700
Price breaks above ₹700.
Later, when price falls toward ₹700:
₹700 may now act as support.
Breakout Trading
A breakout occurs when price moves strongly above resistance.
Bullish Breakout
Price breaks above resistance.
Often accompanied by:
- High volume
- Strong momentum
Breakdown Trading
A breakdown occurs when price falls below support.
Bearish Breakdown
Price breaks below support.
Often indicates weakness.
Importance of Volume
Volume helps confirm support and resistance signals.
High Volume Breakout
More reliable.
Low Volume Breakout
Higher chance of failure.
Support & Resistance in Different Trading Styles
Intraday Trading
Used for:
- Entry points
- Stop-loss placement
- Profit targets
Swing Trading
Helps identify:
- Reversal zones
- Breakout opportunities
Positional Trading
Used to track major market levels.
Long-Term Investing
Helps investors identify attractive buying zones.
Best Indicators to Combine with Support & Resistance
RSI
Confirms momentum.
MACD
Confirms trend strength.
Moving Averages
Identify overall trend direction.
Volume Analysis
Confirms breakouts and breakdowns.
Common Beginner Mistakes
Drawing Too Many Levels
Focus on major levels only.
Treating Levels as Exact Prices
Support and resistance are zones, not precise numbers.
Ignoring Volume
Volume confirms reliability.
Trading Every Breakout
Wait for confirmation.
No Risk Management
Always use stop-loss orders.
Practical Trading Example
Suppose:
Stock Price = ₹650
Support = ₹600
Resistance = ₹700
Possible Strategies:
Buy Near Support
Risk-controlled entry.
Sell Near Resistance
Profit-taking opportunity.
Buy After Breakout Above ₹700
If supported by strong volume.
Advantages of Support & Resistance
Easy to Understand
Suitable for beginners.
Works Across All Markets
Stocks, forex, commodities, and crypto.
Helps Risk Management
Improves stop-loss placement.
Improves Trade Timing
Identifies key decision zones.
Limitations of Support & Resistance
Not Always Accurate
Levels can break unexpectedly.
Requires Confirmation
Should not be used alone.
Subjective Analysis
Different traders may draw different levels.
Best Way for Beginners to Learn
Step 1
Learn chart basics.
Step 2
Identify previous highs and lows.
Step 3
Draw major support and resistance zones.
Step 4
Practice on historical charts.
Step 5
Combine with volume and trend analysis.
Support and Resistance are foundational concepts in technical analysis. Support represents areas where buyers are likely to emerge, while Resistance represents areas where sellers become active. Understanding these levels can help traders identify entry points, exit points, stop-loss placements, and potential trend reversals.
Although Support and Resistance are powerful tools, they should be combined with volume analysis, trend analysis, and risk management for better results. Mastering these concepts can significantly improve trading consistency and decision-making.
Remember: Support and Resistance are not exact prices—they are zones where market participants are likely to react.
Frequently Asked Questions (FAQs)
1. What is Support in the stock market?
Support is a price level where buying interest is strong enough to prevent further price declines.
2. What is Resistance in the stock market?
Resistance is a price level where selling pressure prevents the stock from moving higher.
3. Why do Support and Resistance levels form?
They form because of buyer and seller psychology, demand, and supply dynamics.
4. Can Support become Resistance?
Yes. Once broken, a support level can act as future resistance.
5. Can Resistance become Support?
Yes. After a breakout, resistance often becomes support.
6. How do traders identify Support levels?
By analyzing previous swing lows, price reactions, and volume activity.
7. How do traders identify Resistance levels?
By studying previous swing highs and areas of repeated selling pressure.
8. Are Support and Resistance exact prices?
No. They are generally considered zones rather than exact levels.
9. Should beginners use Support and Resistance?
Yes. It is one of the simplest and most effective concepts in technical analysis.
10. Can Support and Resistance guarantee profitable trades?
No. They provide probabilities, not certainty. Proper risk management is always necessary.