
Trend Lines and Channels are among the most effective tools in technical analysis. They help traders identify market direction, spot potential entry and exit points, and understand the overall trend structure. Whether you are an intraday trader, swing trader, positional trader, or long-term investor, learning to draw and interpret trend lines and channels can significantly improve your chart analysis.
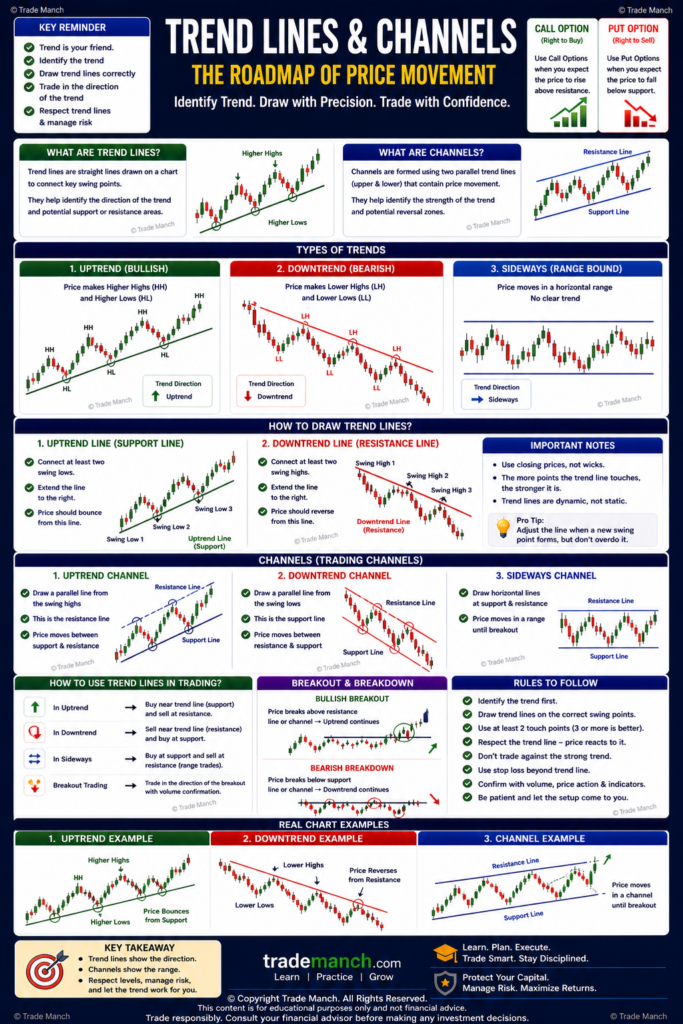
This guide explains Trend Lines and Channels in simple language with practical examples.
What Are Trend Lines?
A Trend Line is a straight line drawn on a chart that connects important price points and shows the direction of the market trend.
Trend lines help traders:
- Identify trends
- Find support and resistance
- Spot breakout opportunities
- Plan entries and exits
Simple Definition of Trend Line
A Trend Line is a line drawn on a chart to show the direction of price movement.
Why Trend Lines Are Important
Trend lines help traders:
Identify Market Direction
Determine whether the market is rising, falling, or moving sideways.
Find Entry Opportunities
Buy near support in an uptrend.
Manage Risk
Place stop-loss orders more effectively.
Spot Trend Reversals
Identify potential changes in market direction.
Types of Trend Lines
Uptrend Line
An Uptrend Line is drawn by connecting higher lows.
It slopes upward from left to right.
Characteristics
Rising Prices
The market is making higher highs and higher lows.
Dynamic Support
The trend line often acts as support.
Example of Uptrend
If a stock forms lows at:
- ₹500
- ₹550
- ₹600
A trend line connecting these lows creates an upward-sloping support line.
Downtrend Line
A Downtrend Line is drawn by connecting lower highs.
It slopes downward from left to right.
Characteristics
Falling Prices
The market is making lower highs and lower lows.
Dynamic Resistance
The trend line often acts as resistance.
Example of Downtrend
If a stock forms highs at:
- ₹1,000
- ₹950
- ₹900
Connecting these highs creates a downward-sloping resistance line.
Sideways Trend
When prices move within a range without a clear direction.
Characteristics
No Strong Trend
Buyers and sellers are balanced.
Range-Bound Movement
Prices fluctuate between support and resistance.
How to Draw Trend Lines
Step 1
Identify significant swing highs or swing lows.
Step 2
Connect at least two major points.
Step 3
Extend the line into the future.
Step 4
Look for multiple touches.
The more times price respects the line, the stronger it becomes.
Rules for Drawing Trend Lines
Use Major Price Points
Ignore small market noise.
Avoid Forcing the Line
Let the chart guide the trend line.
More Touches Increase Reliability
Three or more touches generally strengthen the trend line.
Trend Line Support
In an uptrend, the trend line acts as dynamic support.
What Happens?
When price approaches the trend line:
- Buyers often become active.
- Price may bounce upward.
Trend Line Resistance
In a downtrend, the trend line acts as dynamic resistance.
What Happens?
When price approaches the trend line:
- Sellers often become active.
- Price may move lower.
Trend Line Breakouts
A breakout occurs when price moves through a trend line.
Bullish Breakout
Price breaks above a downtrend line.
May signal:
Trend Reversal
Potential upward movement.
Bearish Breakdown
Price breaks below an uptrend line.
May signal:
Trend Weakness
Potential downward movement.
Importance of Volume in Breakouts
Volume helps confirm trend line breakouts.
High Volume Breakout
More reliable.
Low Volume Breakout
Higher chance of failure.
What Are Channels?
A Channel consists of two parallel trend lines that contain price movement.
Channels help traders identify:
- Trend direction
- Support zones
- Resistance zones
- Profit targets
Simple Definition of Channel
A Channel is formed by two parallel lines that contain price action within a trend.
Types of Channels
Ascending Channel
An upward-sloping channel.
Characteristics
Higher Highs
Higher Lows
Price moves upward within the channel.
Trading Strategy
Buy near lower channel support.
Sell near upper channel resistance.
Descending Channel
A downward-sloping channel.
Characteristics
Lower Highs
Lower Lows
Price moves downward within the channel.
Trading Strategy
Sell near upper resistance.
Cover positions near lower support.
Horizontal Channel
Also known as a trading range.
Characteristics
Sideways Movement
Price oscillates between support and resistance.
Trading Strategy
Buy near support.
Sell near resistance.
How to Draw Channels
Step 1
Draw a trend line.
Step 2
Draw a parallel line connecting opposite price extremes.
Step 3
Adjust until the channel contains most price action.
Why Channels Work
Channels represent market structure.
Lower Boundary
Acts as support.
Upper Boundary
Acts as resistance.
Channel Breakouts
Price may eventually break out of the channel.
Bullish Breakout
Price breaks above channel resistance.
May indicate:
Strong Momentum
Potential continuation or reversal.
Bearish Breakdown
Price breaks below channel support.
May indicate:
Increased Selling Pressure
Potential trend change.
Trend Lines vs Channels
| Feature | Trend Line | Channel |
|---|---|---|
| Number of Lines | One | Two |
| Purpose | Identify Trend | Identify Trend & Trading Range |
| Support/Resistance | One Side | Both Sides |
| Complexity | Simple | More Advanced |
Combining Trend Lines with Other Tools
Support & Resistance
Confirms important price levels.
Moving Averages
Helps identify trend direction.
RSI
Measures momentum.
MACD
Confirms trend strength.
Volume Analysis
Confirms breakouts and reversals.
Common Beginner Mistakes
Drawing Too Many Trend Lines
Focus on major trends.
Forcing Trend Lines
Trend lines should fit naturally.
Ignoring Volume
Volume helps validate signals.
Trading Every Breakout
Wait for confirmation.
Ignoring Overall Trend
Always consider the broader market direction.
Best Practices for Trend Line Trading
Use Multiple Time Frames
Confirm trends across charts.
Wait for Confirmation
Avoid premature entries.
Use Stop-Loss Orders
Protect capital.
Combine Multiple Signals
Trend lines work best with other tools.
Advantages of Trend Lines and Channels
Easy to Learn
Suitable for beginners.
Effective Across Markets
Stocks, forex, commodities, and crypto.
Helps Identify Trends
Provides market structure.
Supports Risk Management
Improves stop-loss placement.
Limitations of Trend Lines and Channels
Subjective Analysis
Different traders may draw lines differently.
False Breakouts
Not all breakouts lead to trends.
Requires Practice
Drawing accurate trend lines takes experience.
Trend Lines in Different Trading Styles
Intraday Trading
Identify short-term trends.
Swing Trading
Track multi-day trends.
Positional Trading
Monitor medium-term market direction.
Long-Term Investing
Identify major market cycles.
Trend Lines and Channels are powerful technical analysis tools that help traders understand market direction, identify support and resistance, and spot potential trading opportunities. Trend lines reveal the underlying trend, while channels provide a structured framework for analyzing price movement within that trend.
When combined with volume analysis, support and resistance, and proper risk management, Trend Lines and Channels can significantly improve trading decisions and market understanding.
Remember: trend lines and channels are guides, not guarantees. Always use confirmation and risk management before entering any trade.
Frequently Asked Questions (FAQs)
1. What is a Trend Line?
A Trend Line is a line drawn on a chart to show the direction of price movement.
2. What is an Uptrend Line?
An Uptrend Line connects higher lows and acts as dynamic support.
3. What is a Downtrend Line?
A Downtrend Line connects lower highs and acts as dynamic resistance.
4. What is a Channel in technical analysis?
A Channel consists of two parallel lines that contain price movement.
5. What is an Ascending Channel?
An upward-sloping channel formed by higher highs and higher lows.
6. What is a Descending Channel?
A downward-sloping channel formed by lower highs and lower lows.
7. How many points are needed to draw a Trend Line?
At least two points are required, but three or more touches improve reliability.
8. Why is volume important in Trend Line breakouts?
High volume helps confirm the validity of a breakout.
9. Can Trend Lines predict future prices?
No. They help identify trends and probabilities, not guaranteed outcomes.
10. Are Trend Lines suitable for beginners?
Yes. Trend Lines are among the simplest and most effective technical analysis tools for beginners.