
Liquidity and Volume are two of the most important concepts in the stock market. Whether you are an investor, swing trader, intraday trader, or long-term trader, understanding liquidity and volume can help you make better trading decisions and avoid unnecessary risks.
Many beginners focus only on stock prices, but professional traders closely monitor liquidity and volume because they reveal important information about market activity, buying interest, selling pressure, and the ease of entering or exiting a trade.
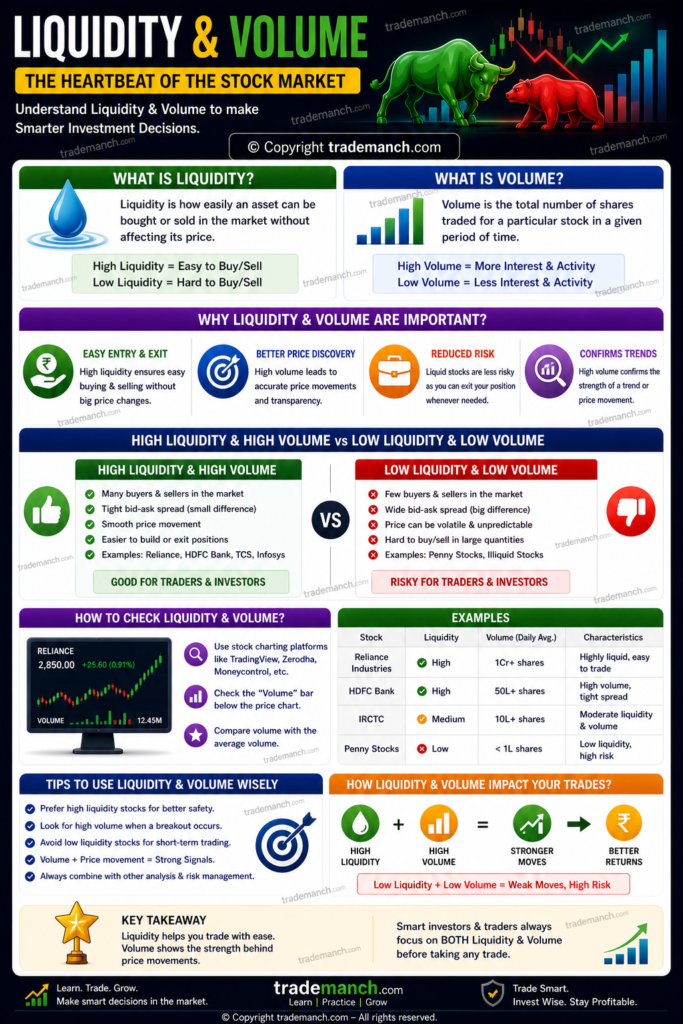
In this complete guide, you’ll learn what liquidity and volume are, how they differ, why they matter, and how to use them effectively in trading and investing.
What Is Liquidity?
Liquidity refers to how easily a stock or financial asset can be bought or sold in the market without significantly affecting its price.
A highly liquid stock has:
- Many buyers
- Many sellers
- Fast order execution
- Small bid-ask spreads
Simple Definition of Liquidity
Liquidity is the ease with which an asset can be converted into cash without causing a major change in its market price.
Example of Liquidity
Suppose you want to sell shares worth ₹1,00,000.
If buyers are readily available and your shares are sold instantly near the market price:
- The stock is highly liquid.
If it takes a long time to find buyers:
- The stock has low liquidity.
Why Liquidity Is Important
Liquidity helps traders:
- Enter trades quickly
- Exit trades easily
- Reduce transaction costs
- Avoid large price fluctuations
High liquidity is generally preferred.
Characteristics of High Liquidity Stocks
High Trading Activity
Many participants trade daily.
Narrow Bid-Ask Spread
Difference between buying and selling price is small.
Easy Order Execution
Orders are filled quickly.
Lower Price Manipulation
Difficult for a few traders to influence prices.
Characteristics of Low Liquidity Stocks
Fewer Buyers and Sellers
Limited market participation.
Wider Bid-Ask Spread
Higher trading costs.
Slow Order Execution
Trades may take longer to execute.
Higher Volatility
Prices can move sharply.
What Is Trading Volume?
Volume refers to the total number of shares traded during a specific period.
It measures market activity and participation.
Simple Definition of Volume
Volume is the total quantity of shares bought and sold during a given time period.
Volume Formula
Volume is simply:
Volume=Total Shares Traded
Example of Volume
Suppose:
- 10,000 shares are bought
- 10,000 shares are sold
Trading Volume:
10000 Shares
Volume = 10,000 shares
Why Volume Is Important
Volume helps traders:
- Confirm trends
- Identify breakouts
- Measure market interest
- Detect institutional activity
High volume often indicates strong market participation.
Liquidity vs Volume
Many beginners confuse liquidity and volume.
| Feature | Liquidity | Volume |
|---|---|---|
| Meaning | Ease of buying and selling | Number of shares traded |
| Focus | Market efficiency | Market activity |
| Measurement | Bid-Ask Spread & Depth | Shares Traded |
| Impact | Trade execution | Trend confirmation |
Relationship Between Liquidity and Volume
Generally:
- Higher Volume = Higher Liquidity
- Lower Volume = Lower Liquidity
However, they are not always identical.
A stock may occasionally have high volume but still experience liquidity issues.
How Volume Helps Traders
Volume provides clues about market sentiment.
Rising Price + High Volume
Usually indicates strong buying interest.
Bullish signal.
Rising Price + Low Volume
Trend may be weak.
Potential warning sign.
Falling Price + High Volume
Strong selling pressure.
Bearish signal.
Falling Price + Low Volume
Weak selling activity.
Volume and Breakout Trading
Volume is extremely important for breakouts.
Strong Breakout
- Resistance breaks
- Volume increases significantly
Usually considered more reliable.
Weak Breakout
- Resistance breaks
- Volume remains low
Higher probability of failure.
Volume and Trend Confirmation
Professional traders often use volume to confirm trends.
Example:
A stock rises from ₹500 to ₹550.
If volume increases:
- Trend strength is confirmed.
If volume declines:
- Trend may weaken.
Liquidity in Different Market Cap Stocks
Large Cap Stocks
Usually have:
- High liquidity
- High volume
- Lower volatility
Examples:
- Reliance Industries
- HDFC Bank
- Infosys
Mid Cap Stocks
Generally have:
- Moderate liquidity
- Moderate volume
Small Cap Stocks
Often have:
- Lower liquidity
- Lower trading volume
- Higher volatility
Why Traders Prefer Liquid Stocks
Liquid stocks provide:
Faster Entry and Exit
Orders execute quickly.
Better Price Stability
Less slippage.
Lower Trading Costs
Narrow spreads reduce expenses.
Easier Risk Management
Stop-loss orders execute more efficiently.
Understanding Bid-Ask Spread
The bid-ask spread is a key liquidity indicator.
Example:
Buyer Price (Bid) = ₹500
Seller Price (Ask) = ₹501
Spread:
501−500=1
Spread = ₹1
Smaller spreads indicate higher liquidity.
Volume Indicators Used by Traders
Several indicators analyze volume.
Volume Bars
Most basic volume tool.
On-Balance Volume (OBV)
Measures cumulative buying and selling pressure.
Volume Profile
Shows trading activity at different price levels.
VWAP (Volume Weighted Average Price)
Popular among institutional traders.
Liquidity Risk
Liquidity risk occurs when traders cannot exit positions easily.
Common in:
- Small Cap stocks
- Penny stocks
- Thinly traded securities
This can lead to:
- Delayed execution
- Larger losses
- Price slippage
How to Check Liquidity
Look for:
- Daily trading volume
- Bid-ask spread
- Market depth
- Order book activity
How Beginners Should Use Volume
Confirm Breakouts
High volume strengthens breakout signals.
Confirm Trends
Strong trends often have increasing volume.
Avoid Low-Volume Stocks
They may be difficult to trade.
Monitor Institutional Activity
Large volume spikes often indicate institutional participation.
Common Beginner Mistakes
Ignoring Volume
Price alone does not tell the full story.
Trading Illiquid Stocks
Can increase risk significantly.
Chasing Volume Spikes
Not every volume increase is a trading opportunity.
Ignoring Bid-Ask Spread
Wide spreads increase trading costs.
Liquidity and Volume in Intraday Trading
Intraday traders often prefer:
- High-volume stocks
- Highly liquid stocks
Because:
- Faster execution
- Better opportunities
- Lower slippage
Liquidity and Volume in Long-Term Investing
Investors also benefit from:
- Easy buying and selling
- Better price discovery
- Lower transaction costs
Can High Volume Guarantee Profits?
No.
High volume only indicates activity.
Successful trading still requires:
- Risk management
- Strategy
- Technical analysis
- Market discipline
Liquidity and Volume are essential concepts for every trader and investor. Liquidity determines how easily an asset can be bought or sold, while volume measures the level of trading activity.
High liquidity and strong volume generally indicate healthier and more efficient markets. By understanding how liquidity and volume work together, traders can improve trade execution, confirm trends, identify breakouts, and manage risk more effectively.
Whether you’re trading intraday, swing trading, or investing for the long term, liquidity and volume should always be part of your market analysis.
Frequently Asked Questions (FAQs)
1. What is liquidity in the stock market?
Liquidity is the ease with which a stock can be bought or sold without affecting its price significantly.
2. What is trading volume?
Trading volume is the total number of shares traded during a specific period.
3. Why is liquidity important?
It allows traders to enter and exit positions easily.
4. Why is volume important?
Volume helps confirm trends and measure market activity.
5. What is the difference between liquidity and volume?
Liquidity measures ease of trading, while volume measures trading activity.
6. Are high-volume stocks always liquid?
Usually, but not always.
7. What is a bid-ask spread?
The difference between the highest buying price and the lowest selling price.
8. Why do traders prefer liquid stocks?
Because they offer faster execution and lower trading costs.
9. Can low liquidity be risky?
Yes. It can make exiting trades difficult and increase losses.
10. Which stocks usually have the highest liquidity?
Large Cap stocks generally have the highest liquidity and trading volume.