
Option Chain Analysis is one of the most powerful tools used by professional traders to understand market sentiment, identify support and resistance levels, analyze institutional positions, and make informed trading decisions. Whether you trade stocks, indices, or derivatives, learning how to read an option chain can significantly improve your market analysis.
Many successful traders use option chain data daily because it provides valuable insights that are not visible on price charts alone.
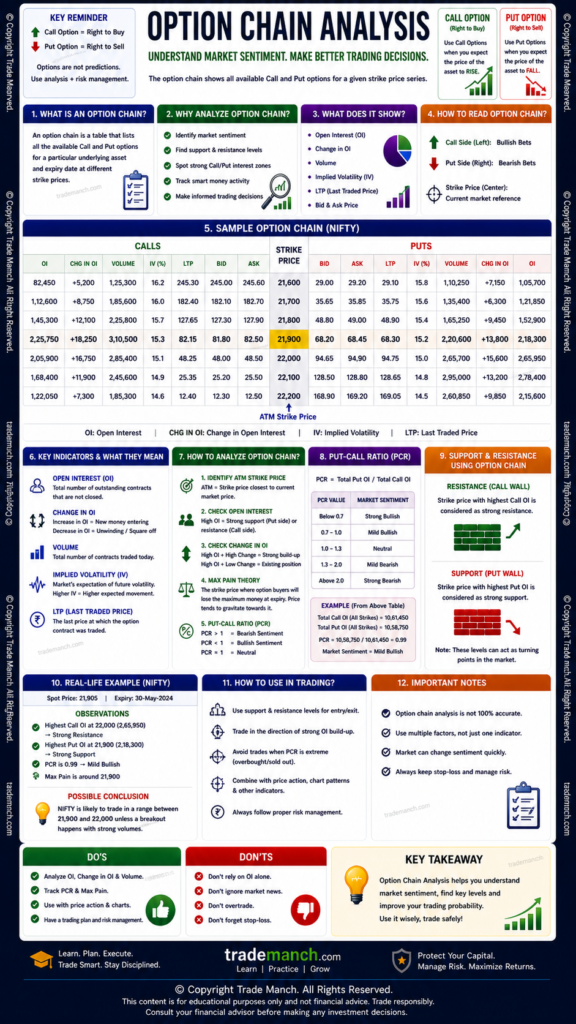
In this complete guide, you’ll learn what an option chain is, how it works, key terms, and how beginners can use option chain analysis effectively.
What Is an Option Chain?
An Option Chain is a table that displays all available Call Options (CE) and Put Options (PE) for a particular stock or index along with important market data.
It shows:
- Strike Prices
- Open Interest (OI)
- Change in Open Interest
- Volume
- Premium
- Implied Volatility
- Bid and Ask Prices
Simple Definition of Option Chain
An Option Chain is a detailed list of all Call and Put Options available for a stock or index.
Why Is Option Chain Analysis Important?
Option Chain Analysis helps traders:
- Identify support levels
- Identify resistance levels
- Understand market sentiment
- Track institutional activity
- Analyze volatility
- Plan trades more effectively
Structure of an Option Chain
A typical option chain contains:
Call Option Data (CE)
Displayed on the left side.
Strike Price
Displayed in the center.
Put Option Data (PE)
Displayed on the right side.
Basic Components of an Option Chain
Strike Price
The predetermined price at which an option can be exercised.
Example:
- 25,000
- 25,100
- 25,200
for a Nifty option chain.
Open Interest (OI)
Open Interest represents the total number of active option contracts.
Change in Open Interest
Shows how many new contracts were added or closed during the trading session.
Volume
The total number of contracts traded during the day.
Premium
The market price of the option.
Implied Volatility (IV)
Measures expected future volatility.
Understanding Open Interest (OI)
Open Interest is one of the most important metrics in option chain analysis.
Simple Definition
Open Interest is the total number of outstanding option contracts that remain open.
Why Open Interest Matters
OI helps identify:
- Market sentiment
- Support zones
- Resistance zones
- Institutional positions
Call Open Interest Analysis
High Call Open Interest often indicates resistance.
Reason:
Many traders are betting that the market may struggle to move above that level.
Example
Suppose:
25,500 Strike Call has the highest OI.
This may indicate:
Potential Resistance
Market may face selling pressure near 25,500.
Put Open Interest Analysis
High Put Open Interest often indicates support.
Reason:
Many traders are betting that the market may stay above that level.
Example
Suppose:
24,500 Strike Put has the highest OI.
This may indicate:
Potential Support
Market may find buying interest near 24,500.
Support and Resistance Through Option Chain
One of the most popular uses of option chain analysis is identifying support and resistance.
Highest Put OI
Usually indicates:
Strong Support
Highest Call OI
Usually indicates:
Strong Resistance
Understanding Change in Open Interest
Change in OI helps identify fresh positions.
Increasing OI
New positions are being created.
Decreasing OI
Existing positions are being closed.
Price and OI Interpretation
Price Up + OI Up
Usually indicates:
Long Build-Up
Bullish signal.
Price Down + OI Up
Usually indicates:
Short Build-Up
Bearish signal.
Price Up + OI Down
Usually indicates:
Short Covering
Positive signal.
Price Down + OI Down
Usually indicates:
Long Unwinding
Weakness in trend.
Understanding Option Volume
Volume shows market participation.
High Volume
Indicates strong trader interest.
Low Volume
Indicates lower participation.
Importance of Implied Volatility (IV)
Implied Volatility reflects expected future market movement.
High IV
Options become expensive.
Often occurs before:
- Earnings
- RBI Policy
- Budget
- Major Events
Low IV
Options become cheaper.
Usually seen in stable markets.
PCR (Put-Call Ratio)
PCR is one of the most popular option chain indicators.
PCR Formula
PCR=Call Open InterestPut Open Interest
Interpreting PCR
PCR Above 1
Generally indicates bullish sentiment.
PCR Below 1
Generally indicates bearish sentiment.
Extremely High PCR
May indicate excessive bullishness.
Extremely Low PCR
May indicate excessive bearishness.
Option Chain Analysis for Nifty
Many traders use option chain analysis on:
- NIFTY 50
because it has high liquidity and strong institutional participation.
Example of Nifty Option Chain Analysis
Suppose:
Highest Call OI
25,500
Potential resistance.
Highest Put OI
25,000
Potential support.
Expected range:
25,000 – 25,500
until significant OI changes occur.
Option Chain Analysis for Bank Nifty
Many traders also analyze:
- NIFTY Bank
because of its volatility and liquidity.
How Institutional Traders Use Option Chains
Institutions often analyze:
OI Build-Up
Identify market positioning.
Volatility Changes
Monitor risk expectations.
Large Position Shifts
Track major market participants.
Advantages of Option Chain Analysis
Identifies Support and Resistance
Very useful for traders.
Reveals Market Sentiment
Shows bullish or bearish positioning.
Tracks Institutional Activity
Provides insights into professional participation.
Complements Technical Analysis
Works well alongside charts and indicators.
Limitations of Option Chain Analysis
Not Always Accurate
Support and resistance levels can break.
Dynamic Data
OI changes continuously.
Requires Interpretation
Data alone does not guarantee success.
Common Beginner Mistakes
Looking Only at Open Interest
Consider volume and price action too.
Ignoring Change in OI
Fresh positions matter.
Blindly Trading Based on OI Levels
Always confirm with charts.
Ignoring Market Context
News and events can override option chain signals.
Best Practices for Beginners
Learn Open Interest First
It is the foundation of option chain analysis.
Track Major OI Levels
Identify support and resistance zones.
Monitor PCR
Use as a sentiment indicator.
Combine with Technical Analysis
Use charts for confirmation.
Follow OI Changes Daily
Market positioning changes frequently.
Option Chain vs Technical Analysis
| Feature | Option Chain | Technical Analysis |
|---|---|---|
| Focus | Market Positioning | Price Action |
| Data Source | Derivatives Market | Charts |
| Best Use | Support & Resistance | Trend Analysis |
| Users | F&O Traders | All Traders |
Professional traders often combine both methods.
Can Option Chain Predict Market Direction?
No.
Option Chain Analysis helps estimate:
- Market sentiment
- Important levels
- Institutional positioning
but it cannot guarantee future market movements.
Option Chain Analysis is one of the most valuable tools for F&O traders. By studying Open Interest, Change in OI, Volume, Implied Volatility, and Put-Call Ratio, traders can identify important support and resistance levels, understand market sentiment, and track institutional activity.
For beginners, the best approach is to start with Open Interest and PCR before moving to more advanced concepts. When combined with technical analysis and proper risk management, option chain analysis can become a powerful part of a trader’s toolkit.
Remember: the option chain provides clues, not certainty. Always use risk management and confirmation before taking trades.
Frequently Asked Questions (FAQs)
What is an option chain?
An option chain is a table showing all available Call and Put Options along with market data.
Why is option chain analysis important?
It helps identify support, resistance, and market sentiment.
What is Open Interest?
Open Interest is the total number of active option contracts.
How does Call OI indicate resistance?
High Call OI often suggests traders expect prices to remain below that level.
How does Put OI indicate support?
High Put OI often suggests traders expect prices to stay above that level.
What is PCR?
PCR (Put-Call Ratio) measures the relationship between Put and Call Open Interest.
What does PCR above 1 mean?
Generally indicates bullish sentiment.
What is Implied Volatility?
It measures expected future price movement.
Can option chain analysis predict the market?
No. It provides probabilities and market insights, not guarantees.
Should beginners use option chain analysis?
Yes. It is one of the most useful tools for understanding market positioning.