
Financial ratios are among the most powerful tools used by successful investors to evaluate companies before investing. They help simplify complex financial statements and provide insights into a company’s profitability, valuation, efficiency, growth potential, and financial health.
Whether you are a beginner investor or an experienced market participant, understanding financial ratios can help you make better investment decisions and avoid financially weak companies.
In this complete guide, you’ll learn the most important financial ratios every investor should know and how to use them effectively.
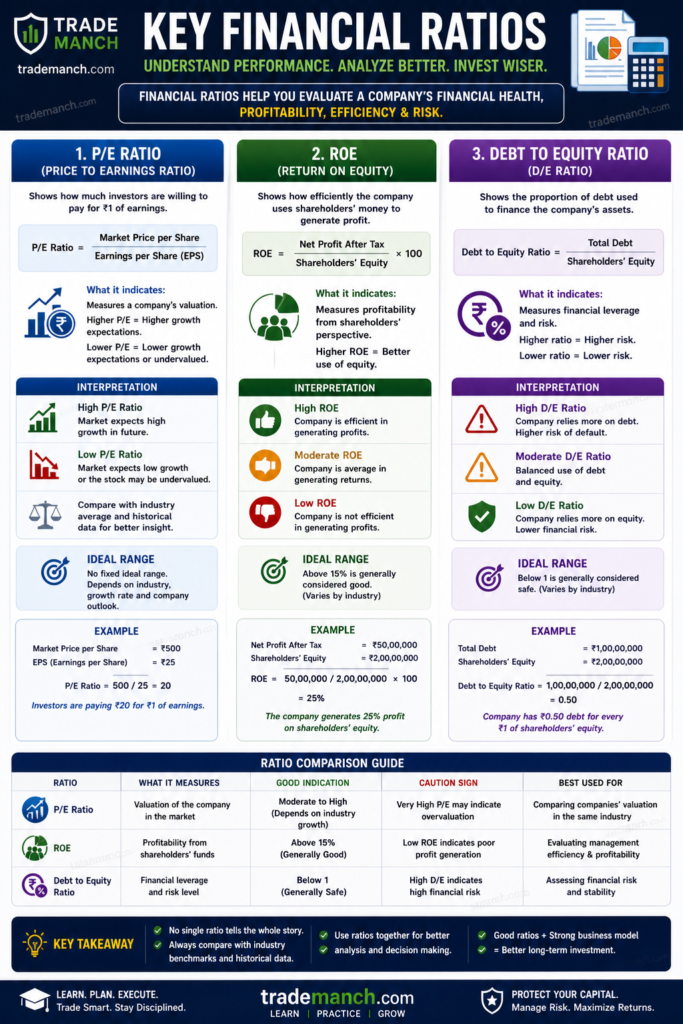
If you want to invest smartly in stocks listed on indices like NIFTY 50, mastering these ratios is essential.
In this complete guide, you’ll learn the most important financial ratios every investor should know and how to use them effectively.
What Are Financial Ratios?
Financial ratios are mathematical calculations derived from a company’s financial statements.
They help investors analyze:
- Profitability
- Valuation
- Debt levels
- Efficiency
- Growth
- Financial stability
Simple Definition of Financial Ratios
Financial ratios are numerical measures used to evaluate a company’s financial performance and health.
Why Financial Ratios Are Important
Financial ratios help investors:
Compare Companies
Compare businesses within the same industry.
Identify Strong Businesses
Spot financially healthy companies.
Avoid Risky Investments
Detect warning signs early.
Make Better Decisions
Support data-driven investing.
Valuation Ratios
Valuation ratios help determine whether a stock is expensive or inexpensive.
Price-to-Earnings (P/E) Ratio
The P/E Ratio is one of the most popular valuation metrics.
Formula
P/E Ratio=Earnings Per ShareShare Price
Example
Stock Price = ₹500
EPS = ₹25
P/E Ratio:
25500=20
P/E = 20
Interpretation
High P/E
May indicate:
- High growth expectations
- Overvaluation
Low P/E
May indicate:
- Undervaluation
- Slower growth
Price-to-Book (P/B) Ratio
Measures market value relative to book value.
Formula
P/B Ratio=Book Value Per ShareMarket Price
Interpretation
Below 1
May indicate undervaluation.
Above 1
Market values the company above its book value.
Profitability Ratios
These ratios measure how effectively a company generates profits.
Return on Equity (ROE)
One of the most important ratios for investors.
Formula
ROE=Shareholders′ EquityNet Profit×100
Interpretation
Above 15%
Generally considered strong.
Higher ROE
Indicates efficient use of shareholder capital.
Return on Assets (ROA)
Measures how efficiently assets generate profit.
Formula
ROA=Total AssetsNet Profit×100
Why It Matters
Higher ROA indicates better asset utilization.
Net Profit Margin
Shows how much profit remains from revenue.
Formula
Net Profit Margin=RevenueNet Profit×100
Example
Revenue = ₹1,000 Crore
Net Profit = ₹100 Crore
Margin:
1000100×100=10%
Interpretation
Higher margins often indicate stronger businesses.
Debt Ratios
Debt ratios help assess financial risk.
Debt-to-Equity Ratio (D/E)
One of the most important risk indicators.
Formula
Debt to Equity=Shareholders′ EquityTotal Debt
Interpretation
Below 1
Generally considered healthy.
Above 2
May indicate higher financial risk.
Interest Coverage Ratio
Measures ability to pay interest expenses.
Formula
Interest Coverage=Interest ExpenseEBIT
Interpretation
Higher values indicate stronger debt-servicing ability.
Liquidity Ratios
Liquidity ratios measure short-term financial strength.
Current Ratio
Measures ability to meet short-term obligations.
Formula
Current Ratio=Current LiabilitiesCurrent Assets
Interpretation
Above 1
Generally considered healthy.
Below 1
May indicate liquidity concerns.
Quick Ratio
A stricter liquidity measure.
Formula
Quick Ratio=Current LiabilitiesCurrent Assets−Inventory
Why It Matters
Focuses on liquid assets only.
Growth Ratios
Growth ratios measure business expansion.
Revenue Growth Rate
Measures sales growth.
Formula
Revenue Growth=Previous RevenueCurrent Revenue−Previous Revenue×100
Earnings Growth Rate
Measures profit growth.
Formula
EPS Growth=Previous EPSCurrent EPS−Previous EPS×100
Why Growth Matters
Consistent growth often supports long-term stock performance.
Shareholder Ratios
These ratios focus on investor returns.
Earnings Per Share (EPS)
Measures profit generated per share.
Formula
EPS=Outstanding SharesNet Profit
Interpretation
Higher EPS generally indicates stronger profitability.
Dividend Yield
Measures dividend income relative to stock price.
Formula
Dividend Yield=Share PriceAnnual Dividend×100
Why It Matters
Important for income-focused investors.
Efficiency Ratios
Efficiency ratios evaluate operational performance.
Asset Turnover Ratio
Measures revenue generated from assets.
Formula
Asset Turnover=Total AssetsRevenue
Interpretation
Higher values indicate efficient asset utilization.
Inventory Turnover Ratio
Measures how quickly inventory is sold.
Formula
Inventory Turnover=Average InventoryCost of Goods Sold
Why It Matters
Higher turnover often indicates operational efficiency.
Most Important Ratios for Beginners
If you’re new to investing, focus on:
ROE
Measures profitability.
P/E Ratio
Measures valuation.
Debt-to-Equity Ratio
Measures financial risk.
EPS Growth
Measures earnings growth.
Current Ratio
Measures liquidity.
Ideal Financial Ratio Checklist
| Ratio | Preferred Value |
|---|---|
| ROE | Above 15% |
| Debt-to-Equity | Below 1 |
| Current Ratio | Above 1 |
| EPS Growth | Positive & Consistent |
| Revenue Growth | Positive & Consistent |
| Net Profit Margin | Increasing Trend |
Common Beginner Mistakes
Looking at One Ratio Only
Always analyze multiple ratios together.
Comparing Different Industries
Compare companies within the same sector.
Ignoring Growth
A low P/E alone does not make a stock attractive.
Ignoring Debt
Debt can significantly impact future performance.
Focusing Only on Historical Data
Consider future growth prospects as well.
How Professional Investors Use Ratios
Professional investors typically:
Screen Stocks
Using financial filters.
Compare Competitors
Within the same industry.
Track Trends
Over multiple years.
Combine Ratios with Business Analysis
Financial ratios are only one part of the investment process.
Best Sources for Financial Ratios
Investors commonly use:
for financial data and ratio analysis.
Financial ratios are essential tools for evaluating stocks and identifying quality businesses. Ratios such as P/E, ROE, Debt-to-Equity, EPS, Current Ratio, and Profit Margin provide valuable insights into a company’s valuation, profitability, financial health, and growth potential.
No single ratio can determine whether a stock is a good investment. Successful investors analyze multiple ratios together, compare them with industry peers, and evaluate long-term business prospects before making investment decisions.
Remember: great investing starts with understanding the numbers behind the business.
Frequently Asked Questions (FAQs)
What are financial ratios?
Financial ratios are calculations used to evaluate a company’s financial performance and health.
Which ratio is most important for investors?
ROE, P/E Ratio, and Debt-to-Equity Ratio are among the most important.
What is a good ROE?
Many investors prefer ROE above 15%.
What does the P/E Ratio measure?
It measures valuation relative to earnings.
What is Debt-to-Equity Ratio?
It measures financial leverage and debt risk.
Why is EPS important?
EPS shows profit earned per share.
What is Current Ratio?
It measures short-term liquidity.
Can one ratio determine a good stock?
No. Multiple ratios should be analyzed together.
Why compare ratios within the same industry?
Different industries have different financial characteristics.
Where can I find financial ratios?
Financial websites and company annual reports provide ratio data.