Technical indicators are powerful tools that help traders analyze market trends, momentum, and potential trading opportunities. Among hundreds of indicators available, Moving Averages (MA & EMA), RSI (Relative Strength Index), and MACD (Moving Average Convergence Divergence) are the most popular and widely used by traders worldwide.
Whether you’re an intraday trader, swing trader, or long-term investor, understanding these indicators can improve your market analysis and decision-making.
What Are Technical Indicators?
Technical indicators are mathematical calculations based on price, volume, or market data that help traders identify trends and trading opportunities.
They help traders:
- Identify trends
- Measure momentum
- Find entry points
- Find exit points
- Manage risk
Simple Definition of Technical Indicators
Technical indicators are tools that help traders understand market direction and strength using historical price data.
Why Are Indicators Important?
Indicators help traders:
Identify Market Trends
Determine whether the market is bullish or bearish.
Confirm Trading Signals
Support price action analysis.
Improve Timing
Help find better entries and exits.
Reduce Emotional Decisions
Provide objective market analysis.
Moving Average (MA)
What Is a Moving Average?
A Moving Average (MA) is a trend-following indicator that calculates the average price of a stock over a specific period.
It smooths price fluctuations and helps identify the overall trend.
Simple Definition of MA
A Moving Average shows the average price of a stock over a selected time period.
Moving Average Formula
SMA=Number of PeriodsSum of Closing Prices
Example of Simple Moving Average (SMA)
Suppose the last 5 closing prices are:
- ₹100
- ₹105
- ₹110
- ₹115
- ₹120
Average:
5100+105+110+115+120=110
5-Day SMA = ₹110
Types of Moving Averages
Simple Moving Average (SMA)
Gives equal weight to all prices.
Exponential Moving Average (EMA)
Gives more weight to recent prices.
Common Moving Averages
20-Day MA
Short-term trend.
50-Day MA
Medium-term trend.
200-Day MA
Long-term trend.
Advantages of Moving Averages
Easy to Use
Suitable for beginners.
Identifies Trend Direction
Helps avoid trading against the trend.
Dynamic Support & Resistance
Moving averages often act as support and resistance levels.
Limitations of Moving Averages
Lagging Indicator
Based on historical prices.
False Signals in Sideways Markets
Less effective during consolidation.
Exponential Moving Average (EMA)
What Is EMA?
EMA is a type of Moving Average that gives greater importance to recent price data.
This makes EMA more responsive than SMA.
Simple Definition of EMA
EMA reacts faster to price changes because recent prices receive more weight.
Why Traders Prefer EMA
Faster Signals
Responds quickly to trend changes.
Better for Short-Term Trading
Popular among intraday and swing traders.
Common EMA Settings
9 EMA
Very short-term trend.
20 EMA
Short-term trend.
50 EMA
Medium-term trend.
200 EMA
Long-term trend.
EMA Trading Strategy
Bullish Signal
Short-term EMA crosses above long-term EMA.
Example:
20 EMA crosses above 50 EMA.
Bearish Signal
Short-term EMA crosses below long-term EMA.
Example:
20 EMA crosses below 50 EMA.
RSI (Relative Strength Index)
What Is RSI?
RSI is a momentum indicator that measures the speed and strength of price movements.
Developed by J. Welles Wilder Jr., RSI helps identify overbought and oversold conditions.
Simple Definition of RSI
RSI measures whether a stock is overbought or oversold.
RSI Range
RSI moves between:
0 to 100
RSI Formula
RSI=100−1+RS100
Key RSI Levels
Above 70
Overbought Zone
May indicate a potential pullback.
Below 30
Oversold Zone
May indicate a potential bounce.
Around 50
Neutral Zone
No strong momentum signal.
RSI Example
Suppose:
RSI = 75
This suggests:
Strong Buying Momentum
But the stock may be approaching overbought territory.
Advantages of RSI
Easy to Interpret
Clear overbought and oversold levels.
Useful for Momentum Analysis
Measures trend strength.
Limitations of RSI
Can Stay Overbought or Oversold
During strong trends.
Should Not Be Used Alone
Requires confirmation from price action.
MACD (Moving Average Convergence Divergence)
What Is MACD?
MACD is a trend-following momentum indicator developed by Gerald Appel.
It helps traders identify:
- Trend direction
- Momentum
- Potential reversals
Simple Definition of MACD
MACD shows the relationship between two moving averages.
Components of MACD
MACD Line
Measures trend momentum.
Signal Line
Used to generate trading signals.
Histogram
Shows the difference between MACD and Signal Line.
MACD Formula
MACD=EMA(12)−EMA(26)
MACD Signals
Bullish Crossover
MACD Line crosses above Signal Line.
Interpretation
Potential buying opportunity.
Bearish Crossover
MACD Line crosses below Signal Line.
Interpretation
Potential selling opportunity.
MACD Histogram
Expanding Histogram
Increasing momentum.
Shrinking Histogram
Weakening momentum.
Advantages of MACD
Trend Identification
Useful for spotting trend changes.
Momentum Analysis
Measures market strength.
Widely Used
Popular among professional traders.
Limitations of MACD
Lagging Indicator
Signals may occur after the move begins.
False Signals
Possible during sideways markets.
Moving Average vs RSI vs MACD
| Indicator | Purpose | Best For |
|---|---|---|
| Moving Average | Trend Identification | Trend Following |
| EMA | Faster Trend Analysis | Short-Term Trading |
| RSI | Momentum Analysis | Overbought/Oversold Conditions |
| MACD | Trend + Momentum | Trend Reversals |
How Traders Combine These Indicators
Moving Average
Identifies trend.
RSI
Measures momentum.
MACD
Confirms trend strength.
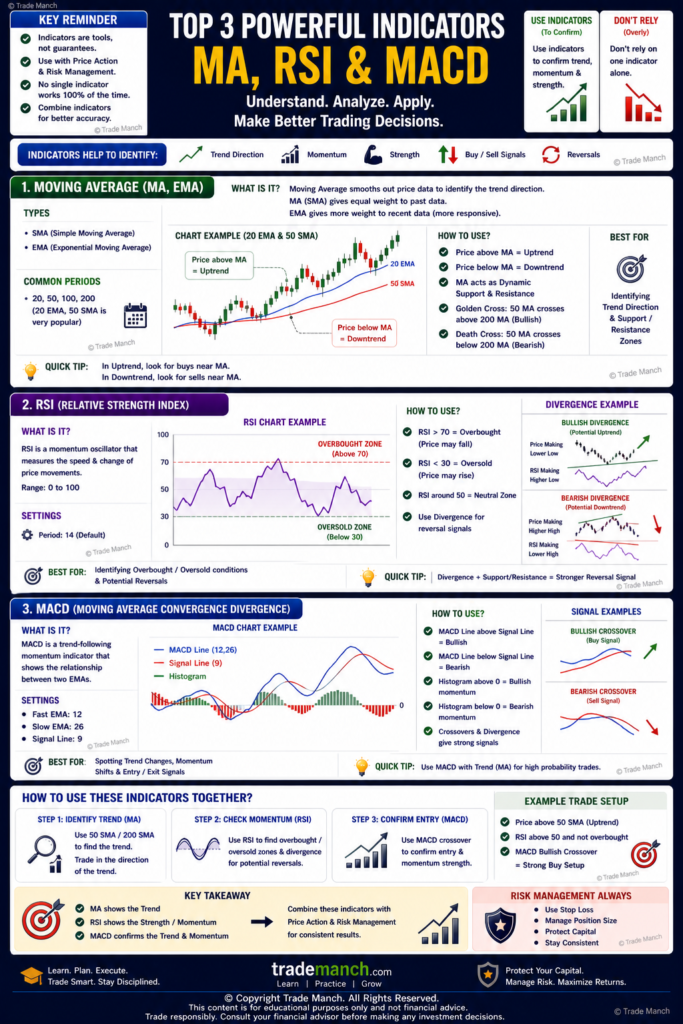
Example Strategy
Step 1
Price above 50 EMA.
Bullish trend.
Step 2
RSI above 50.
Positive momentum.
Step 3
MACD bullish crossover.
Trend confirmation.
Result
Higher-probability trade setup.
Common Beginner Mistakes
Using Too Many Indicators
Leads to confusion.
Ignoring Price Action
Indicators should support, not replace, chart analysis.
Trading Every Signal
Wait for confirmation.
No Risk Management
Always use stop-loss orders.
Best Indicators for Beginners
If you’re starting out:
1. Moving Average
For trend identification.
2. RSI
For momentum analysis.
3. MACD
For trend confirmation.
Moving Averages (MA & EMA), RSI, and MACD are among the most effective technical indicators for traders and investors. Moving Averages help identify trends, RSI measures momentum and overbought/oversold conditions, while MACD combines trend and momentum analysis.
No indicator is perfect. The best approach is to combine indicators with price action, support and resistance, volume analysis, and proper risk management. When used correctly, these tools can help traders make more informed and disciplined trading decisions.
Remember: Indicators provide guidance, not guarantees.
Frequently Asked Questions (FAQs)
1. What is a Moving Average (MA)?
A Moving Average is a trend-following indicator that shows the average price over a specific period.
2. What is the difference between SMA and EMA?
SMA gives equal weight to all prices, while EMA gives more importance to recent prices.
3. What is RSI?
RSI (Relative Strength Index) is a momentum indicator that measures overbought and oversold conditions.
4. What does RSI above 70 mean?
It generally indicates that a stock may be overbought.
5. What does RSI below 30 mean?
It generally indicates that a stock may be oversold.
6. What is MACD?
MACD is a trend-following momentum indicator that measures the relationship between two EMAs.
7. What is a MACD bullish crossover?
It occurs when the MACD Line crosses above the Signal Line, indicating potential bullish momentum.
8. Which indicator is best for beginners?
Moving Averages, RSI, and MACD are among the best indicators for beginners.
9. Can indicators guarantee profits?
No. Indicators provide signals and probabilities, not certainty.
10. Should indicators be used alone?
No. Always combine indicators with price action, support and resistance, and risk management.