
Before investing in any company, successful investors analyze its financial statements. Two of the most important financial reports are the Balance Sheet and the Profit & Loss (P&L) Statement.
These reports help investors understand:
- Financial strength
- Profitability
- Debt levels
- Business growth
- Long-term sustainability
Legendary investors like Warren Buffett focus heavily on financial statements before investing.
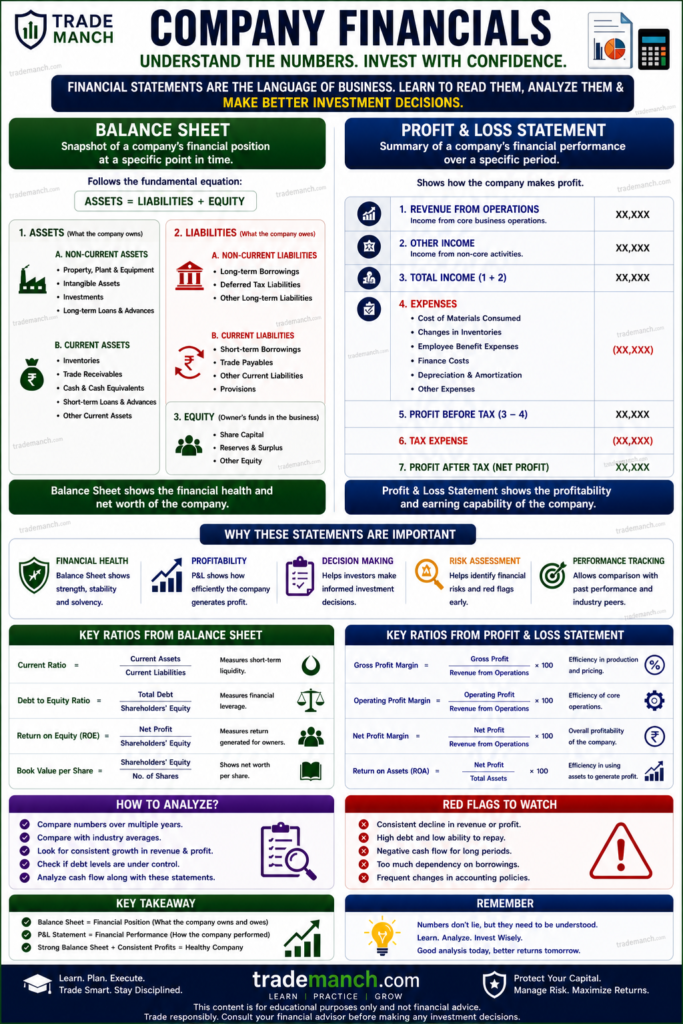
This guide explains Balance Sheets and Profit & Loss Statements in simple language, making it easy for beginners to understand.
What Are Financial Statements?
Financial statements are official reports that show a company’s financial performance and position.
The three major financial statements are:
Balance Sheet
Shows what a company owns and owes.
Profit & Loss Statement
Shows income and expenses.
Cash Flow Statement
Shows movement of cash.
Why Financial Statements Matter
Financial statements help investors:
Evaluate Company Health
Understand financial stability.
Measure Profitability
Check earnings performance.
Assess Debt Levels
Identify financial risk.
Compare Companies
Make better investment decisions.
What Is a Balance Sheet?
A Balance Sheet shows a company’s financial position at a specific point in time.
It provides information about:
- Assets
- Liabilities
- Shareholders’ Equity
Simple Definition of Balance Sheet
A Balance Sheet shows what a company owns, what it owes, and what belongs to shareholders.
Balance Sheet Formula
The Balance Sheet follows a simple equation:
Assets=Liabilities+Shareholders′ Equity
This equation must always balance.
Main Components of a Balance Sheet
Assets
Liabilities
Shareholders’ Equity
Assets
What Are Assets?
Assets are resources owned by a company that have economic value.
Current Assets
Assets expected to be converted into cash within one year.
Examples:
Cash & Cash Equivalents
Money available immediately.
Accounts Receivable
Money customers owe to the company.
Inventory
Products available for sale.
Non-Current Assets
Long-term assets.
Examples:
Property
Land and buildings.
Plant & Machinery
Production equipment.
Investments
Long-term investments.
Why Assets Matter
Higher-quality assets often indicate:
- Business strength
- Growth potential
- Financial stability
Liabilities
What Are Liabilities?
Liabilities are obligations the company must pay.
Current Liabilities
Must be paid within one year.
Examples:
Accounts Payable
Money owed to suppliers.
Short-Term Loans
Debt due within one year.
Non-Current Liabilities
Long-term obligations.
Examples:
Long-Term Debt
Loans payable over multiple years.
Bonds
Borrowed funds from investors.
Why Liabilities Matter
Excessive debt may indicate:
- Financial stress
- Higher risk
- Reduced profitability
Shareholders’ Equity
What Is Shareholders’ Equity?
Equity represents the owners’ stake in the company.
It is calculated as:
Equity=Assets−Liabilities
Components of Equity
Share Capital
Money invested by shareholders.
Retained Earnings
Profits reinvested into the business.
Why Equity Matters
Growing equity often indicates:
- Strong business performance
- Long-term value creation
Example Balance Sheet
Suppose a company has:
Assets = ₹1,000 Crore
Liabilities = ₹400 Crore
Equity:
1000−400=600
Equity = ₹600 Crore
This means shareholders effectively own ₹600 Crore of the company’s value.
Important Balance Sheet Ratios
Debt-to-Equity Ratio
Measures debt relative to equity.
Formula:
Debt to Equity=Shareholders′ EquityTotal Debt
Lower values are generally preferred.
Current Ratio
Measures short-term financial strength.
Formula:
Current Ratio=Current LiabilitiesCurrent Assets
A ratio above 1 is generally considered healthy.
What Is a Profit & Loss Statement?
The Profit & Loss Statement (P&L) shows a company’s financial performance over a period.
It summarizes:
- Revenue
- Expenses
- Profit
Simple Definition of P&L Statement
A Profit & Loss Statement shows how much money a company earned and spent during a specific period.
Main Components of a P&L Statement
Revenue
Expenses
Profit
Revenue
What Is Revenue?
Revenue is the total income generated from business operations.
Also known as:
- Sales
- Turnover
Example
If a company sells products worth ₹500 Crore:
Revenue = ₹500 Crore
Why Revenue Matters
Growing revenue often indicates:
- Increasing demand
- Business expansion
Expenses
What Are Expenses?
Expenses are costs incurred while operating the business.
Common Expenses
Raw Material Costs
Production expenses.
Employee Salaries
Staff compensation.
Marketing Expenses
Advertising costs.
Interest Expenses
Loan-related costs.
Why Expenses Matter
Higher expenses can reduce profitability.
Profit
What Is Profit?
Profit is the amount remaining after expenses are deducted from revenue.
Profit Formula
Profit=Revenue−Expenses
Types of Profit
Gross Profit
Profit after deducting production costs.
Formula:
Gross Profit=Revenue−COGS
Operating Profit
Profit after operating expenses.
Net Profit
Final profit after all expenses and taxes.
Formula:
Net Profit=Revenue−Total Expenses
Example P&L Statement
Revenue = ₹500 Crore
Expenses = ₹400 Crore
Net Profit:
500−400=100
Net Profit = ₹100 Crore
Important P&L Ratios
Net Profit Margin
Measures profitability.
Formula:
Net Profit Margin=RevenueNet Profit×100
Higher margins are generally better.
Earnings Per Share (EPS)
Measures profit per share.
Formula:
EPS=Outstanding SharesNet Profit
Return on Equity (ROE)
Measures profitability relative to equity.
Formula:
ROE=Shareholders′ EquityNet Profit×100
Balance Sheet vs Profit & Loss Statement
| Feature | Balance Sheet | Profit & Loss Statement |
|---|---|---|
| Purpose | Financial Position | Financial Performance |
| Time Frame | Specific Date | Period of Time |
| Focus | Assets, Liabilities, Equity | Revenue, Expenses, Profit |
| Importance | Financial Stability | Profitability |
How Investors Analyze Financial Statements
Step 1: Check Revenue Growth
Consistent growth is positive.
Step 2: Check Profit Growth
Rising profits indicate business strength.
Step 3: Examine Debt
Avoid excessively leveraged companies.
Step 4: Review Equity Growth
Growing equity is generally favorable.
Step 5: Analyze Ratios
Focus on:
- ROE
- EPS
- Debt-to-Equity
- Profit Margins
Common Beginner Mistakes
Looking Only at Revenue
Revenue without profit is not enough.
Ignoring Debt
High debt can increase risk.
Focusing on One Year
Analyze multiple years of data.
Ignoring Cash Flow
Profit does not always equal cash generation.
Red Flags to Watch
Declining Revenue
May indicate business weakness.
Rising Debt
Can increase financial risk.
Falling Profit Margins
May indicate increasing costs.
Negative Cash Flow
Requires further investigation.
Best Financial Websites for Analysis
Investors often use:
to access company financial statements.
The Balance Sheet and Profit & Loss Statement are two of the most important tools for stock market investors. The Balance Sheet helps evaluate a company’s financial strength by analyzing assets, liabilities, and equity, while the Profit & Loss Statement reveals how effectively the company generates profits.
Investors who learn to read financial statements can identify strong businesses, avoid financially weak companies, and make better long-term investment decisions.
Remember: successful investing begins with understanding the numbers behind the business.
Frequently Asked Questions (FAQs)
What is a Balance Sheet?
A Balance Sheet shows a company’s assets, liabilities, and shareholders’ equity.
What is a Profit & Loss Statement?
A P&L Statement shows revenue, expenses, and profit over a specific period.
Why is the Balance Sheet important?
It helps evaluate financial stability and debt levels.
Why is the P&L Statement important?
It helps measure profitability and business performance.
What are assets?
Resources owned by a company.
What are liabilities?
Financial obligations owed by the company.
What is shareholders’ equity?
The owners’ stake in the company.
What is revenue?
The total income generated from business operations.
What is net profit?
The final profit after all expenses and taxes.
Which financial statement should investors analyze first?
Most investors start with the Profit & Loss Statement and then review the Balance Sheet and Cash Flow Statement.