Best Indicators for Trading:- Technical indicators are important tools used by traders to analyze price movement, identify trends, and make trading decisions. Among hundreds of indicators available, the most popular and beginner-friendly indicators are:
- RSI (Relative Strength Index)
- MACD (Moving Average Convergence Divergence)
- Moving Averages
These indicators help traders:
Improve trading decisions
Identify trends
Find entry and exit points
Measure momentum
In this complete beginner-friendly guide, you will learn how RSI, MACD, and Moving Averages work, their advantages, limitations, and how beginners can use them effectively in trading.
What Are Trading Indicators?
Trading indicators are mathematical calculations based on:
- Price
- Volume
- Market data
They help traders analyze:
- Trend direction
- Momentum
- Volatility
- Market strength
Indicators are commonly used in:
- Intraday trading
- Swing trading
- Forex trading
- Crypto trading
- Stock market trading
Why Traders Use Indicators
Indicators help traders:
- Simplify chart analysis
- Identify trading opportunities
- Confirm trends
- Improve discipline
- Reduce emotional decisions
However, indicators should not be used blindly.
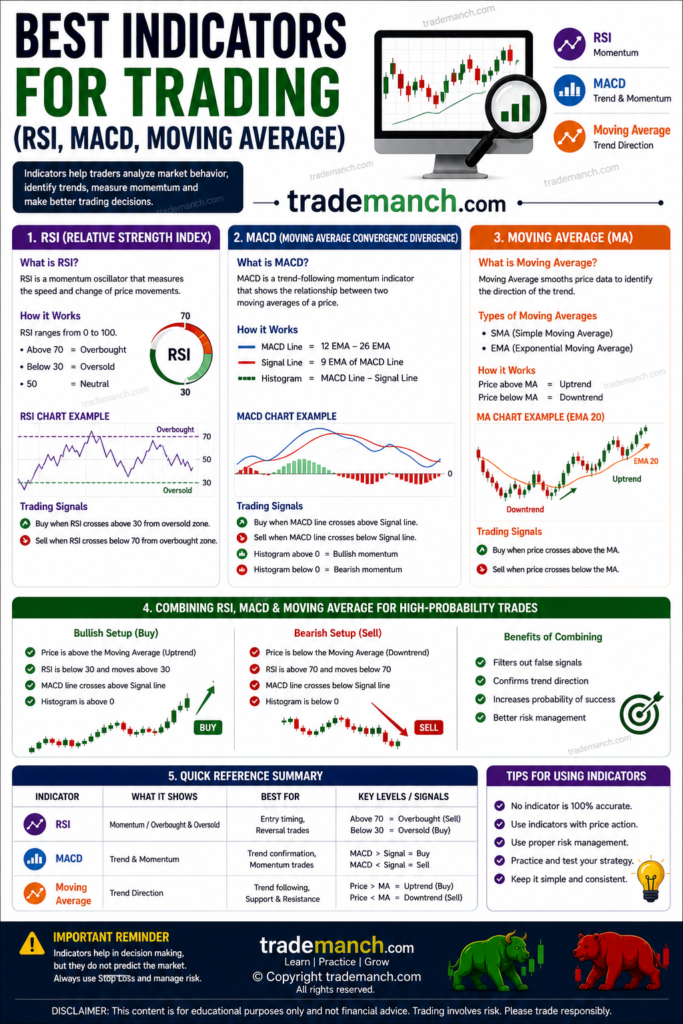
What Is RSI (Relative Strength Index)?
RSI is a momentum indicator developed by J. Welles Wilder Jr..
It measures:
- Speed of price movement
- Strength of momentum
RSI ranges from:
- 0 to 100
RSI Formula
RSI=100−1+RS100
where:
- RS = Average Gain / Average Loss
How RSI Works
RSI Above 70
Indicates:
- Overbought condition
- Possible price correction
RSI Below 30
Indicates:
- Oversold condition
- Possible upward reversal
Example of RSI
If RSI rises to:
- 75 → Market may be overheated.
- 25 → Market may be oversold.
Advantages of RSI
Easy to Understand
Simple for beginners.
Identifies Momentum
Shows market strength clearly.
Helps Detect Reversals
Useful for spotting possible turning points.
Limitations of RSI
False Signals
RSI may remain overbought or oversold during strong trends.
Not Always Accurate Alone
Should be combined with trend analysis.
Best RSI Settings for Beginners
Most traders use:
- 14-period RSI
This is the standard setting.
RSI Trading Strategy for Beginners
Buy Signal
- RSI moves above 30 from oversold zone.
Sell Signal
- RSI falls below 70 from overbought zone.
What Is MACD?
MACD stands for:
- Moving Average Convergence Divergence
It is a trend-following momentum indicator.
MACD helps traders identify:
- Trend direction
- Momentum
- Buy and sell signals
Components of MACD
MACD consists of:
- MACD Line
- Signal Line
- Histogram
MACD Formula
MACD is calculated using moving averages:
MACD=12EMA−26EMA
How MACD Works
Bullish Signal
When MACD line crosses above signal line:
- Possible upward movement.
Bearish Signal
When MACD line crosses below signal line:
- Possible downward movement.
MACD Histogram
The histogram shows:
- Difference between MACD and signal line.
Larger histogram bars indicate stronger momentum.
Advantages of MACD
Good Trend Indicator
Works well in trending markets.
Momentum Analysis
Helps identify trend strength.
Beginner-Friendly
Easy to interpret.
Limitations of MACD
Lagging Indicator
Signals may appear late.
Weak in Sideways Markets
MACD works best in trending conditions.
MACD Trading Strategy for Beginners
Buy Signal
- MACD crosses above signal line.
Sell Signal
- MACD crosses below signal line.
What Is Moving Average?
A Moving Average (MA) smooths price data to identify trend direction.
It helps traders:
- Identify trends
- Reduce market noise
- Find support and resistance zones
Types of Moving Averages
1. Simple Moving Average (SMA)
Calculates average price over a specific period.
Example:
- 50 SMA
- 200 SMA
SMA Formula
SMA=nP1+P2+P3+…+Pn
2. Exponential Moving Average (EMA)
EMA gives more importance to recent prices.
It reacts faster than SMA.
Popular EMAs:
- 20 EMA
- 50 EMA
- 200 EMA
How Moving Averages Work
Uptrend
Price stays above moving average.
Downtrend
Price stays below moving average.
Golden Cross and Death Cross
Golden Cross
Short-term MA crosses above long-term MA.
Signals bullish trend.
Death Cross
Short-term MA crosses below long-term MA.
Signals bearish trend.
Advantages of Moving Averages
Trend Identification
Helps identify market direction.
Dynamic Support and Resistance
Moving averages often act as support/resistance.
Easy for Beginners
Simple and widely used.
Limitations of Moving Averages
Lagging Nature
Signals come after price movement begins.
False Signals in Sideways Markets
Frequent crossovers may confuse traders.
Best Moving Average Settings for Beginners
Commonly used:
- 20 EMA → Short-term trend
- 50 EMA → Medium-term trend
- 200 EMA → Long-term trend
Combining RSI, MACD, and Moving Average
Many traders combine indicators for stronger confirmation.
Example:
- Price above 50 EMA
- RSI above 50
- MACD bullish crossover
This increases probability of trend continuation.
Example Trading Setup
Buy Conditions
- Price above 50 EMA
- RSI above 50
- MACD bullish crossover
Sell Conditions
- Price below 50 EMA
- RSI below 50
- MACD bearish crossover
Indicators vs Price Action
| Indicators | Price Action |
|---|---|
| Uses calculations | Uses raw price movement |
| Easier for beginners | Requires more chart reading skill |
| May lag | Faster market interpretation |
Many traders combine both methods.
Best Indicators for Intraday Trading
Popular intraday indicators:
- RSI
- MACD
- VWAP
- 9 EMA
- 20 EMA
Best Indicators for Swing Trading
Popular swing trading indicators:
- 50 EMA
- MACD
- RSI
- Volume analysis
Common Mistakes Beginners Make
Using Too Many Indicators
Too many indicators create confusion.
Blindly Following Signals
Indicators should support analysis, not replace it.
Ignoring Risk Management
Indicators cannot guarantee profits.
Trading Without Trend Analysis
Trend direction is very important.
Risk Management While Using Indicators
Always:
- Use stop loss
- Follow position sizing
- Avoid emotional trading
Indicators only improve probability, not certainty.
Best Practices for Beginners
Master One or Two Indicators
Avoid complexity initially.
Practice on Demo Account
Gain confidence before real trading.
Combine Indicators With Trend Analysis
Avoid isolated signals.
Stay Disciplined
Follow trading rules consistently.
Which Indicator Is Best?
There is no perfect indicator.
Each indicator serves different purposes:
| Indicator | Purpose |
|---|---|
| RSI | Momentum and reversals |
| MACD | Trend and momentum |
| Moving Average | Trend direction |
Successful traders combine:
- Indicators
- Price action
- Risk management
- Trading psychology
RSI, MACD, and Moving Averages are among the best and most beginner-friendly trading indicators. They help traders identify trends, momentum, reversals, and trading opportunities.
However, indicators should not be used blindly. Successful trading requires:
- Proper risk management
- Market understanding
- Discipline
- Patience
- Emotional control
Beginners should focus on learning a few indicators deeply rather than using too many tools together. Consistency and disciplined practice are more important than finding a “perfect” indicator.
Frequently Asked Questions (FAQs)
1. What is RSI in trading?
RSI is a momentum indicator that measures overbought and oversold conditions.
2. What is MACD?
MACD is a trend-following momentum indicator using moving averages.
3. What is a moving average?
A moving average smooths price data to identify trends.
4. Which indicator is best for beginners?
RSI and Moving Averages are commonly preferred by beginners.
5. Is MACD good for swing trading?
Yes, MACD works well in trending swing markets.
6. What RSI setting is commonly used?
Most traders use 14-period RSI.
7. What is EMA in trading?
EMA stands for Exponential Moving Average.
8. Can indicators guarantee profits?
No, indicators only improve probability.
9. Should beginners use many indicators together?
No, beginners should keep charts simple.
10. Are indicators better than price action?
Both methods have advantages, and many traders combine them.