
Price Action Trading is one of the most popular trading methods used by professional traders around the world. Unlike indicator-based trading, price action trading focuses only on price movement, candlestick patterns, market structure, support and resistance, and trading psychology.
Many successful traders prefer price action because it keeps charts clean and helps traders understand the real behavior of buyers and sellers in the market.
In this complete beginner-friendly guide, you will learn what price action trading is, how it works, important patterns, strategies, and how beginners can start price action trading without indicators.
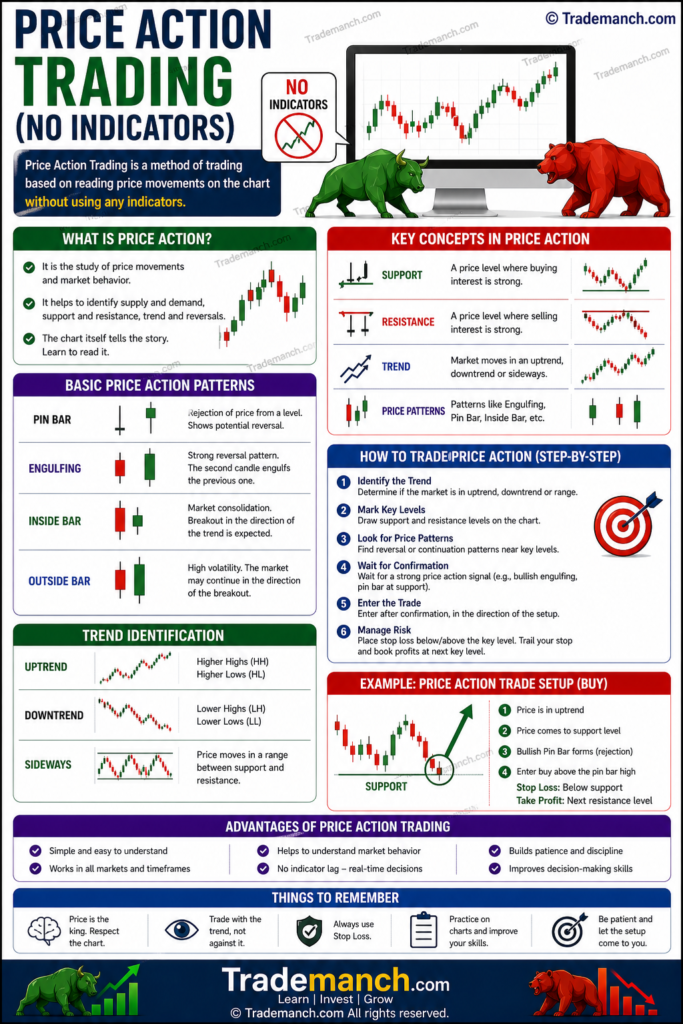
What Is Price Action Trading?
Price action trading is a trading method where traders make decisions based only on:
- Price movement
- Candlestick patterns
- Chart structure
- Support and resistance
In simple words:
- Traders analyze raw price charts without using indicators like RSI, MACD, or Moving Averages.
Simple Definition of Price Action
Price action is the movement of a stock’s price over time shown on a chart.
Price action traders study:
- Candles
- Trends
- Breakouts
- Market structure
to predict future price movement.
Why Traders Use Price Action Trading
Many traders prefer price action because:
- Charts stay simple and clean
- No lagging indicators
- Better understanding of market psychology
- Works in all markets
- Helps improve trading discipline
What Is “No Indicator Trading”?
No indicator trading means:
- Trading directly from price movement
- Avoiding technical indicators
Price action traders mainly focus on:
- Candlestick patterns
- Trend analysis
- Support and resistance
- Volume (optional)
Advantages of Price Action Trading
1. Simple Charts
Charts remain clean and easy to understand.
2. Works in All Markets
Price action works in:
- Stocks
- Forex
- Crypto
- Commodities
- Options trading
3. Real Market Understanding
Traders understand buyer and seller behavior directly.
4. Faster Decision Making
No confusion from multiple indicators.
Disadvantages of Price Action Trading
Requires Practice
Reading charts takes time and experience.
Emotional Discipline Needed
Beginners may struggle with emotional trading.
Subjective Analysis
Different traders may interpret charts differently.
Basic Concepts of Price Action Trading
1. Market Structure
Market structure is the foundation of price action trading.
There are mainly three types:
Uptrend
An uptrend forms:
- Higher highs
- Higher lows
This indicates bullish market strength.
Downtrend
A downtrend forms:
- Lower highs
- Lower lows
This indicates bearish market weakness.
Sideways Market
Price moves within a range without clear direction.
2. Support and Resistance
Support
A price level where buyers enter strongly.
Price often bounces upward from support.
Resistance
A price level where sellers enter strongly.
Price often falls from resistance.
Example
If a stock repeatedly reverses near ₹500:
- ₹500 acts as support or resistance depending on market behavior.
3. Candlestick Patterns
Candlestick patterns are very important in price action trading.
They show:
- Buyer strength
- Seller strength
- Market psychology
Important Price Action Candlestick Patterns
1. Pin Bar Candle
A pin bar has:
- Long wick
- Small body
It shows rejection from a price level.
Bullish Pin Bar
Signals possible upward reversal.
Bearish Pin Bar
Signals possible downward reversal.
2. Engulfing Candle
A large candle completely covers the previous candle.
Bullish Engulfing
Strong buying pressure.
Bearish Engulfing
Strong selling pressure.
3. Doji Candle
A doji shows market indecision.
Buyers and sellers are balanced.
4. Inside Bar Pattern
A small candle forms inside the previous candle.
This often signals:
- Consolidation
- Possible breakout
Importance of Trend in Price Action Trading
“Trend is your friend” is a popular trading rule.
Beginners should:
- Buy in uptrend
- Sell in downtrend
Trading against the trend increases risk.
What Is Breakout Trading?
Breakout happens when price moves strongly above resistance or below support.
Breakouts often lead to:
- High momentum
- Strong market movement
False Breakouts
Sometimes price breaks a level briefly and reverses quickly.
This is called a false breakout or fake breakout.
Price action traders wait for confirmation before entering trades.
Multi-Timeframe Analysis
Professional traders analyze multiple timeframes.
Example:
- Daily chart → Overall trend
- 15-minute chart → Entry point
This improves trade accuracy.
Best Timeframes for Beginners
Swing Trading
- 1-hour
- 4-hour
- Daily charts
Intraday Trading
- 5-minute
- 15-minute charts
Beginners should avoid very low timeframes initially.
Risk Management in Price Action Trading
Risk management is more important than strategy.
Use Stop Loss
A stop loss limits potential losses.
Example:
- Buy at ₹500
- Stop loss at ₹490
Risk:
500−490=10
Risk = ₹10 per share.
Risk-Reward Ratio
Good traders focus on favorable risk-reward ratios.
Example:
- Risk = ₹10
- Target = ₹30
Risk-reward ratio:
1030=3:1
Importance of Patience
Price action trading requires patience.
Good traders:
- Wait for proper setups
- Avoid random entries
- Trade less but better
Common Mistakes Beginners Make
Overtrading
Taking too many trades.
Ignoring Stop Loss
Leads to large losses.
Trading Without Trend Confirmation
Increases failure probability.
Emotional Trading
Fear and greed destroy discipline.
Using Too Many Strategies
Focus on mastering one setup first.
Simple Price Action Strategy for Beginners
Step 1: Identify Trend
Check whether market is:
- Uptrend
- Downtrend
Step 2: Mark Support and Resistance
Draw important price zones.
Step 3: Wait for Candlestick Confirmation
Example:
- Bullish engulfing at support
Step 4: Enter Trade
Take entry after confirmation candle.
Step 5: Place Stop Loss
Always protect capital.
Step 6: Follow Risk Management
Never risk large capital in one trade.
Best Stocks for Price Action Trading
Liquid and high-volume stocks work best.
Examples:
- Reliance Industries
- HDFC Bank
- Infosys
Can Price Action Trading Be Profitable?
Yes, many professional traders use price action successfully.
However:
- Consistency requires practice
- Discipline is essential
- Risk management is critical
There is no guaranteed strategy in trading.
Price Action vs Indicator Trading
| Price Action Trading | Indicator Trading |
|---|---|
| Focus on raw price movement | Uses technical indicators |
| Clean charts | Multiple indicators on chart |
| Faster signals | Indicators may lag |
| Requires chart reading skill | Easier for beginners initially |
Is Price Action Good for Beginners?
Yes, price action trading helps beginners:
- Understand market psychology
- Learn chart reading
- Avoid overdependence on indicators
But beginners must practice extensively before using real money.
Tips for Beginners in Price Action Trading
Learn Market Structure First
Understand trends properly.
Master Few Patterns
Focus on 1–2 setups initially.
Practice on Demo Account
Gain confidence before real trading.
Follow Risk Management
Protect capital at all times.
Maintain Trading Journal
Track mistakes and improve performance.
Price action trading is a powerful trading method based on reading pure market price movement without relying on indicators. It helps traders understand trends, support and resistance, candlestick patterns, and market psychology.
For beginners, price action trading can be highly effective when combined with discipline, patience, and proper risk management. Instead of searching for perfect indicators, focus on understanding how price moves and how traders behave in different market conditions.
Frequently Asked Questions (FAQs)
1. What is price action trading?
Price action trading is trading based on raw price movement without indicators.
2. Is price action trading good for beginners?
Yes, it helps beginners understand market behavior clearly.
3. What indicators are used in price action trading?
Pure price action traders usually avoid indicators.
4. What is the best candlestick pattern for beginners?
Pin bars and engulfing patterns are commonly used.
5. Is price action trading profitable?
Yes, with proper discipline and risk management.
6. What is support and resistance?
Support is a buying zone, while resistance is a selling zone.
7. Can price action trading work in intraday trading?
Yes, many intraday traders use price action strategies.
8. What timeframe is best for beginners?
1-hour and 4-hour charts are generally easier for beginners.
9. Is stop loss important in price action trading?
Yes, stop loss is essential for risk management.
10. Which stocks are good for price action trading?
Highly liquid stocks like Reliance Industries and Infosys are commonly preferred.