
Volatility is one of the most important concepts in trading and investing. It refers to the rate at which the price of a stock, index, commodity, currency, or other financial asset moves up and down over a period of time.
Many beginners view volatility as something negative, but experienced traders understand that volatility creates opportunities. In fact, without price movement, traders would have no opportunity to make profits. However, high volatility also increases risk.
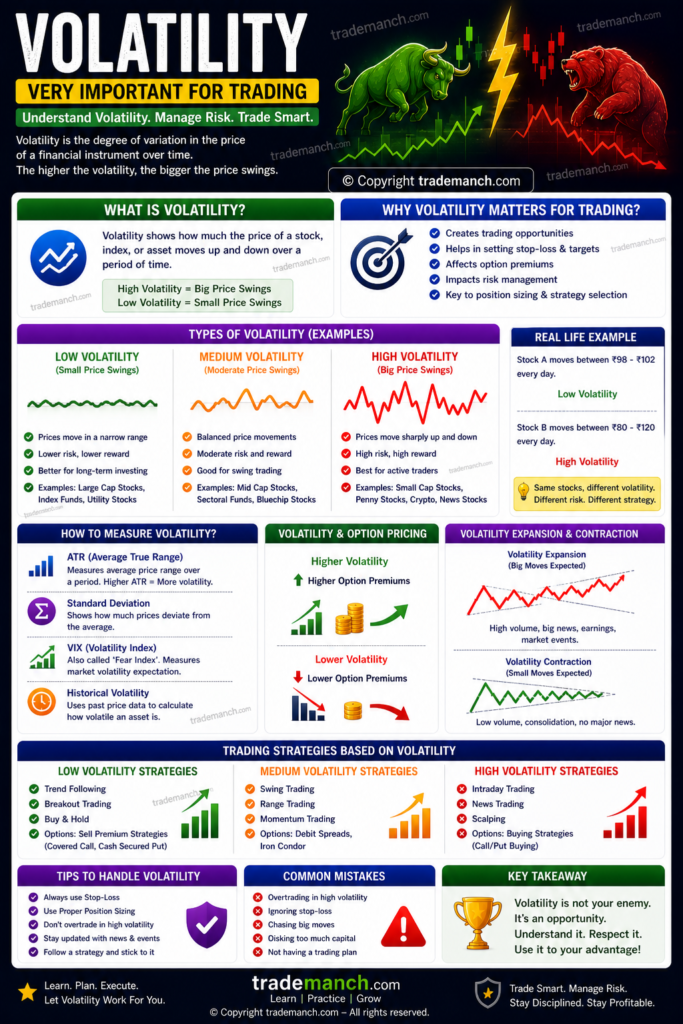
Understanding volatility can help investors manage risk, select suitable investments, and improve trading decisions.
What Is Volatility?
Volatility measures how much the price of a financial asset fluctuates over time.
A highly volatile stock experiences large price swings, while a low-volatility stock moves more gradually.
Simple Definition of Volatility
Volatility is the degree of price movement in a stock or financial asset over a specific period.
Example of Volatility
Suppose Stock A moves:
- ₹500 → ₹505 → ₹510
Small price changes indicate:
- Low Volatility
Now consider Stock B:
- ₹500 → ₹550 → ₹450 → ₹600
Large price swings indicate:
- High Volatility
Why Is Volatility Important?
Volatility helps traders and investors:
- Measure risk
- Assess opportunities
- Select appropriate strategies
- Determine position size
- Manage stop-loss levels
Higher volatility generally means higher risk and higher potential reward.
Types of Volatility
There are two major types of volatility.
Historical Volatility
Historical volatility measures how much a stock’s price has moved in the past.
It is based on actual price data.
Implied Volatility
Implied volatility represents the market’s expectation of future price movement.
It is widely used in options trading.
High Volatility vs Low Volatility
| Feature | High Volatility | Low Volatility |
|---|---|---|
| Price Movement | Large | Small |
| Risk | High | Lower |
| Profit Potential | High | Moderate |
| Uncertainty | Higher | Lower |
| Suitable For | Active Traders | Conservative Investors |
What Causes Volatility?
Several factors can increase market volatility.
Economic News
Events such as:
- GDP data
- Inflation reports
- Interest rate decisions
can create significant price movement.
Corporate Earnings
Strong or weak earnings reports often cause volatility.
Global Events
Examples:
- Wars
- Pandemics
- Political uncertainty
- Natural disasters
Investor Sentiment
Fear and greed can drive rapid price changes.
Market Speculation
Heavy buying and selling activity can increase volatility.
Volatility in Different Market Conditions
Bull Market
Volatility is often lower during strong uptrends.
Investors remain optimistic.
Bear Market
Volatility often increases due to fear and uncertainty.
Large price swings become common.
Measuring Volatility
Volatility is often measured using statistical methods and indicators.
One common measure is:
Standard Deviation
Higher standard deviation indicates higher volatility.
Volatility Formula (Conceptual)
Volatility∝Standard Deviation of Returns
Higher standard deviation means larger price fluctuations.
Volatility and Risk
Volatility is often used as a measure of risk.
Generally:
- Higher Volatility = Higher Risk
- Lower Volatility = Lower Risk
However, volatility alone does not determine investment quality.
Volatility and Return
Higher volatility can create:
- Greater profit opportunities
- Greater loss potential
Example:
A stock moving 10% per day provides more opportunity than one moving 0.5% per day.
Volatility in Different Market Cap Stocks
Large Cap Stocks
Typically:
- Lower volatility
- Stable earnings
- Higher liquidity
Examples:
- Reliance Industries
- Infosys
- HDFC Bank
Mid Cap Stocks
Usually:
- Moderate volatility
- Moderate growth potential
Small Cap Stocks
Often:
- High volatility
- High growth potential
- Higher risk
Volatility in Intraday Trading
Intraday traders often seek volatility because:
- More price movement
- More trading opportunities
- Higher profit potential
However:
- Risk also increases.
Volatility in Swing Trading
Swing traders prefer:
- Moderate to high volatility
because price swings create trading opportunities.
Volatility in Long-Term Investing
Long-term investors often focus less on short-term volatility.
Instead, they focus on:
- Business quality
- Earnings growth
- Competitive advantages
Temporary volatility is often considered normal.
Volatility Indicators Used by Traders
Several indicators help measure volatility.
ATR (Average True Range)
One of the most popular volatility indicators.
Measures average price movement.
Bollinger Bands
Expand during high volatility.
Contract during low volatility.
VIX (Volatility Index)
Measures expected market volatility.
Often called the “Fear Index.”
Understanding ATR
Suppose ATR = ₹10
This means the stock typically moves around:
₹10 per day
Traders often use ATR to:
- Set stop-loss levels
- Determine position size
Volatility and Stop-Loss Placement
Higher volatility generally requires:
- Wider stop-losses
Lower volatility often allows:
- Tighter stop-losses
Example:
Entry = ₹500
ATR = ₹10
Possible Stop-Loss:
500−10=490
Volatility and Position Sizing
Professional traders adjust position size based on volatility.
High Volatility
- Smaller positions
Low Volatility
- Larger positions
This helps maintain consistent risk.
Advantages of Volatility
More Trading Opportunities
Price movement creates setups.
Higher Profit Potential
Large moves can generate significant gains.
Better Trend Development
Volatility often drives strong trends.
Disadvantages of Volatility
Increased Risk
Losses can occur quickly.
Emotional Stress
Rapid price changes can trigger fear and greed.
Difficult Decision-Making
Fast markets require discipline.
Volatility and Market Psychology
Volatility often reflects investor emotions.
During Fear
Prices may fall rapidly.
During Optimism
Prices may rise aggressively.
Understanding market psychology helps traders manage volatility.
Common Beginner Mistakes
Avoiding Volatility Completely
Volatility creates opportunities.
Trading Highly Volatile Stocks Without Risk Management
Can result in large losses.
Ignoring Position Sizing
Volatile stocks require smaller positions.
Removing Stop-Losses
Dangerous during volatile conditions.
How Beginners Should Handle Volatility
Step 1
Understand risk before entering trades.
Step 2
Use stop-loss orders.
Step 3
Adjust position size.
Step 4
Avoid emotional decisions.
Step 5
Focus on quality setups.
Volatility in the Indian Stock Market
Volatility can affect:
- Individual stocks
- Sector indices
- Entire markets
Major indices include:
- NIFTY 50
- BSE Sensex
Market volatility often increases during:
- Budget announcements
- Elections
- Interest rate decisions
- Global economic events
Can Volatility Be Predicted?
Not perfectly.
However, traders use:
- ATR
- Bollinger Bands
- VIX
- Historical Volatility
to estimate potential future volatility.
Volatility is a natural and essential part of financial markets. It represents the degree of price movement and plays a major role in both trading opportunities and investment risk.
High volatility offers greater profit potential but also higher risk, while low volatility generally provides stability with fewer opportunities. By understanding volatility, using proper risk management, position sizing, and stop-loss strategies, traders and investors can make more informed decisions and improve long-term performance.
Remember: volatility is not the enemy. Poor risk management is.
Frequently Asked Questions (FAQs)
1. What is volatility in the stock market?
Volatility measures how much a stock’s price fluctuates over time.
2. Why is volatility important?
It helps assess risk and trading opportunities.
3. Is high volatility good or bad?
It creates opportunities but also increases risk.
4. What causes market volatility?
Economic news, earnings reports, global events, and investor sentiment.
5. Which stocks are usually more volatile?
Small Cap stocks are generally more volatile than Large Cap stocks.
6. What is ATR?
ATR (Average True Range) measures average price movement and volatility.
7. What is the VIX?
VIX is a volatility index that measures expected market volatility.
8. Should beginners trade highly volatile stocks?
Only with proper risk management and position sizing.
9. Can volatility be predicted?
Not exactly, but indicators can estimate potential volatility.
10. Does volatility mean risk?
Higher volatility usually indicates higher risk, but it also creates greater profit opportunities.