🔍 What is the Meeting Lines Pattern?
The Meeting Lines candlestick pattern is a potential reversal signal where two opposite-colored candles close at nearly the same price level.
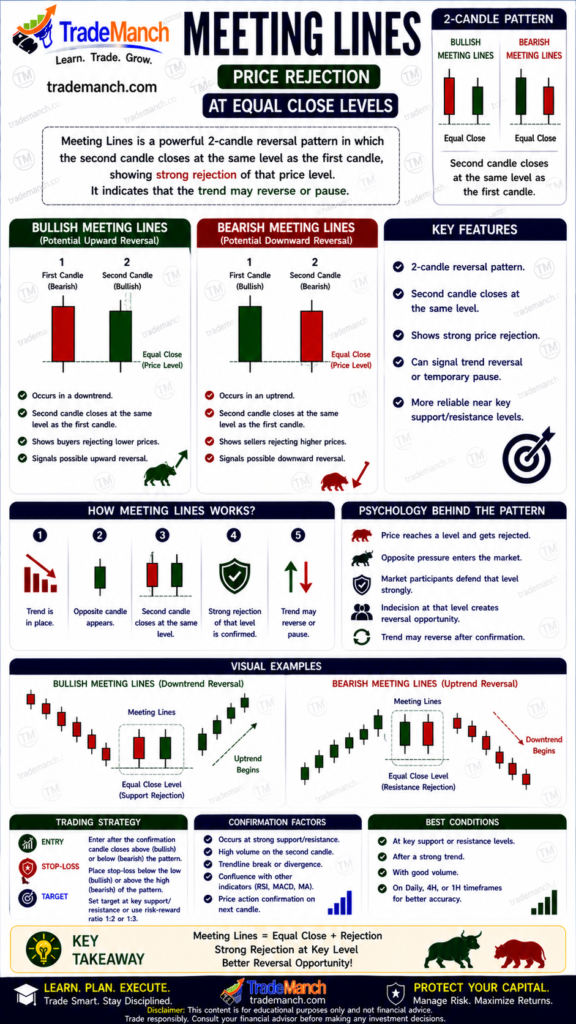
👉 It reflects strong price rejection and indicates that the current trend may be weakening.
The pattern can appear as:
- 🟢 Bullish Meeting Lines → possible bullish reversal
- 🔴 Bearish Meeting Lines → possible bearish reversal
🟢 Bullish Meeting Lines
📈 Structure
- 🔴 Strong bearish candle during a downtrend
- 🟢 Bullish candle opens lower but closes near the previous candle’s close
👉 Signals buyers are defending the closing level strongly.
🔴 Bearish Meeting Lines
📉 Structure
- 🟢 Strong bullish candle during an uptrend
- 🔴 Bearish candle opens higher but closes near the previous candle’s close
👉 Signals sellers are rejecting higher prices.
💡 Psychology Behind the Pattern
The Meeting Lines pattern reflects a battle between buyers and sellers:
- Trend continues strongly at first
- Opposite-side traders suddenly enter
- Market closes near the same level, showing rejection and hesitation
👉 This may indicate weakening momentum and possible reversal.
✅ How to Trade the Meeting Lines Pattern
🔹 Step-by-Step Strategy:
- Identify Existing Trend
- Downtrend → Bullish setup
- Uptrend → Bearish setup
- Look for Equal Closing Prices
Key feature: both candles close at nearly the same level. - Wait for Confirmation
Next candle should confirm reversal direction. - Entry Point
- Buy above bullish confirmation candle
- Sell below bearish confirmation candle
- Stop Loss
Place beyond the high/low of the pattern. - Target
Use support/resistance or reversal targets.
⚠️ Common Mistakes to Avoid
- ❌ Trading without confirmation candle
- ❌ Ignoring overall market trend
- ❌ Confusing with Matching High/Low patterns
- ❌ Using in sideways markets
🔗 Meeting Lines vs Matching High/Low
| Pattern | Key Feature | Signal |
|---|---|---|
| Meeting Lines | Equal closes | Possible reversal |
| Matching High/Low | Equal highs/lows | Support or resistance confirmation |
👉 Meeting Lines focus more on closing-price rejection.
🚀 Pro Tips for Better Accuracy
- Combine with Support & Resistance Levels
- Use volume confirmation
- Check RSI divergence
- Trade with higher timeframe trend analysis
The Meeting Lines pattern is an important signal showing that the current trend may be losing momentum due to strong price rejection at equal closing levels.
👉 While not always a major reversal signal, it can provide early warning of changing market sentiment.