The Simple Moving Average (SMA) is one of the most widely used and beginner-friendly technical indicators in the stock market. It helps traders and investors identify:
Buy and sell opportunities
Market trends
Support levels
Resistance levels
Trend reversals
SMA is commonly used in:
- Stock market trading
- Intraday trading
- Swing trading
- Forex trading
- Cryptocurrency trading
- Long-term investing
This complete guide explains everything about SMA, including formulas, calculations, strategies, advantages, limitations, and practical trading applications.
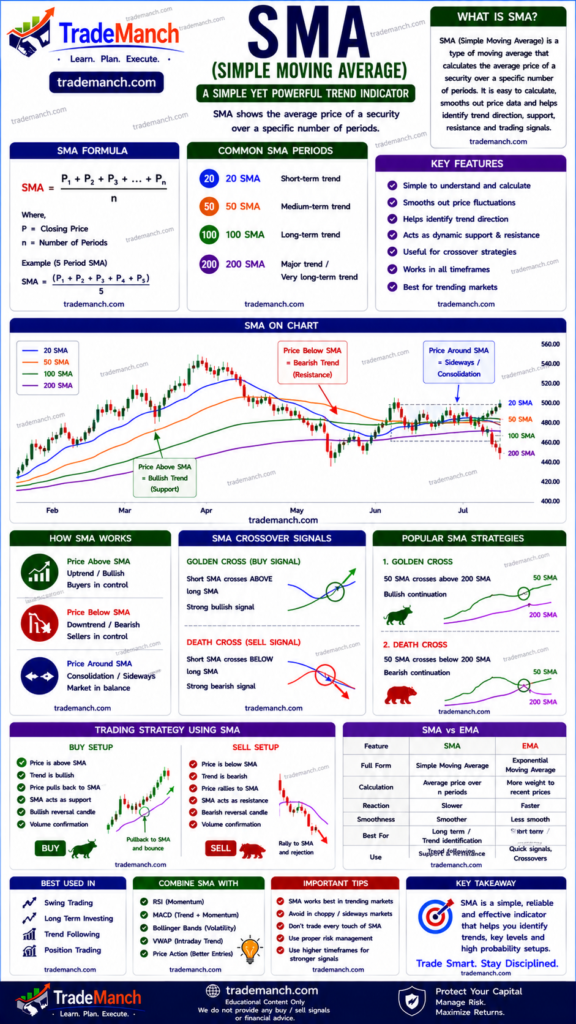
What Is SMA?
SMA stands for:
- Simple Moving Average
It is a trend-following indicator that calculates the average price of a stock or asset over a specific number of periods.
The SMA smooths price fluctuations and helps traders identify the overall market direction.
Simple Definition of SMA
A Simple Moving Average is the average closing price of an asset over a specified number of periods.
Why SMA Is Important
SMA helps traders:
- Identify trends
- Reduce market noise
- Spot support and resistance levels
- Confirm breakouts
- Generate trading signals
It is one of the first indicators beginners learn in technical analysis.
SMA Formula
The Simple Moving Average is calculated using:
SMA=nP1+P2+P3+…+Pn
Where:
- P = Closing price
- n = Number of periods
Example of SMA Calculation
Suppose the last 5 closing prices are:
- ₹100
- ₹105
- ₹110
- ₹115
- ₹120
Calculation:
SMA=5100+105+110+115+120=110
The 5-day SMA equals:
- ₹110
How SMA Works
The SMA creates a smooth line on the chart.
As new prices are added:
- Old prices are removed
- The average updates continuously
This helps traders focus on the trend instead of short-term price fluctuations.
Popular SMA Periods
Different traders use different SMA settings.
| SMA Period | Usage |
|---|---|
| 10 SMA | Short-Term Trading |
| 20 SMA | Intraday Trading |
| 50 SMA | Swing Trading |
| 100 SMA | Medium-Term Trend |
| 200 SMA | Long-Term Trend |
Understanding SMA Signals
Price Above SMA
When price is above SMA:
- Bullish trend
- Buyers dominate
Possible interpretation:
- Uptrend
Price Below SMA
When price is below SMA:
- Bearish trend
- Sellers dominate
Possible interpretation:
- Downtrend
SMA as Dynamic Support
In an uptrend:
- Price often bounces from SMA
The SMA acts as:
- Dynamic support
SMA as Dynamic Resistance
In a downtrend:
- Price often rejects near SMA
The SMA acts as:
- Dynamic resistance
SMA Trading Strategies
1. Price and SMA Strategy
Buy Setup
- Price moves above SMA
- Bullish momentum appears
Possible signal:
- Trend continuation
Sell Setup
- Price moves below SMA
- Bearish momentum appears
Possible signal:
- Trend weakness
2. SMA Crossover Strategy
One of the most popular trading methods.
Golden Cross
Occurs when:
- 50 SMA crosses above 200 SMA
This indicates:
- Strong bullish trend
Golden Cross Formula Concept
50 SMA>200 SMA
Death Cross
Occurs when:
- 50 SMA crosses below 200 SMA
This indicates:
- Strong bearish trend
Death Cross Formula Concept
50 SMA<200 SMA
3. Dual SMA Strategy
Popular combination:
- 20 SMA
- 50 SMA
Buy Signal
- 20 SMA crosses above 50 SMA
Possible bullish momentum.
Sell Signal
- 20 SMA crosses below 50 SMA
Possible bearish momentum.
4. SMA Pullback Strategy
Traders wait for:
- Trend confirmation
- Pullback to SMA
Buy Example
- Uptrend exists
- Price pulls back to 50 SMA
- Bullish candle forms
Possible continuation setup.
SMA in Intraday Trading
Intraday traders commonly use:
- 9 SMA
- 20 SMA
Popular charts:
- 5-minute
- 15-minute
SMA helps identify:
- Trend direction
- Entry opportunities
SMA in Swing Trading
Swing traders prefer:
- 20 SMA
- 50 SMA
These help identify:
- Medium-term trends
SMA in Long-Term Investing
Long-term investors often use:
- 100 SMA
- 200 SMA
to identify:
- Major market trends
SMA in Cryptocurrency Trading
SMA is widely used in:
- Bitcoin
- Ethereum
because crypto markets often follow strong trends.
SMA in Indian Stock Market
Popular stocks for SMA analysis:
- Reliance Industries
- Infosys
- HDFC Bank
These stocks often respect:
- 50 SMA
- 200 SMA
Advantages of SMA
Easy to Understand
Perfect for beginners.
Trend Identification
Clearly shows market direction.
Reduces Market Noise
Filters short-term fluctuations.
Works Across Markets
Useful in:
- Stocks
- Forex
- Crypto
- Commodities
Limitations of SMA
Lagging Indicator
Uses historical prices.
Signals may arrive late.
False Signals in Sideways Markets
Can generate multiple fake crossovers.
Equal Weight to All Prices
Every price gets the same importance.
This can reduce responsiveness.
Common Beginner Mistakes
Trading Every SMA Crossover
Not all crossovers lead to trends.
Ignoring Market Structure
Always analyze support and resistance.
Using SMA Alone
Combine SMA with:
- RSI
- MACD
- Volume Analysis
Choosing Wrong Timeframe
Match SMA settings to your trading style.
Best Indicators to Combine With SMA
Popular combinations:
- SMA + RSI
- SMA + MACD
- SMA + Bollinger Bands
- SMA + Volume Analysis
SMA + RSI Strategy
Buy Example
- Price above 50 SMA
- RSI above 50
Possible bullish trend continuation.
SMA + MACD Strategy
Buy Example
- Price above 200 SMA
- MACD bullish crossover
Strong confirmation signal.
SMA vs EMA
| SMA | EMA |
|---|---|
| Equal weighting | More weight on recent prices |
| Slower response | Faster response |
| Better for long-term analysis | Better for short-term trading |
SMA vs VWAP
| SMA | VWAP |
|---|---|
| Based on price only | Based on price and volume |
| Works on all timeframes | Mainly intraday |
| Trend analysis | Institutional analysis |
Best Timeframes for SMA
| Trading Style | Timeframe |
|---|---|
| Scalping | 1-min / 5-min |
| Intraday Trading | 5-min / 15-min |
| Swing Trading | 1H / Daily |
| Positional Trading | Daily / Weekly |
Risk Management While Using SMA
Always use:
- Stop loss
- Position sizing
- Risk-reward ratio
Example of Risk-Reward Ratio
Suppose:
- Risk = ₹20
- Target = ₹60
Risk-reward ratio:
2060=3:1
Can SMA Guarantee Profits?
No.
SMA helps traders:
- Identify trends
- Improve trade timing
- Understand market direction
It cannot guarantee profitable trades.
Successful trading still requires:
- Discipline
- Risk management
- Emotional control
How Beginners Should Learn SMA
Step 1: Understand Trend Basics
Learn:
- Uptrends
- Downtrends
- Sideways markets
Step 2: Practice SMA Analysis
Study historical charts.
Step 3: Learn SMA Crossovers
Observe Golden Cross and Death Cross setups.
Step 4: Combine With Other Indicators
Avoid relying solely on SMA.
The Simple Moving Average (SMA) is one of the most essential tools in technical analysis. It helps traders identify trends, support and resistance levels, and potential trading opportunities. Because of its simplicity and effectiveness, SMA remains a favorite among beginners and professional traders alike.
When combined with indicators such as RSI, MACD, and Volume Analysis, SMA can significantly improve market analysis and trading decisions.
Frequently Asked Questions (FAQs)
1. What is SMA in trading?
SMA stands for Simple Moving Average and calculates the average price over a specific period.
2. What is the most popular SMA setting?
50 SMA and 200 SMA are widely used by traders and investors.
3. Is SMA a leading or lagging indicator?
SMA is a lagging indicator because it uses past price data.
4. What is a Golden Cross?
A Golden Cross occurs when the 50 SMA crosses above the 200 SMA.
5. What is a Death Cross?
A Death Cross occurs when the 50 SMA crosses below the 200 SMA.
6. Can SMA be used for intraday trading?
Yes, many intraday traders use 9 SMA and 20 SMA.
7. Is SMA better than EMA?
It depends on the trading style. EMA reacts faster, while SMA is smoother.
8. Which indicators work best with SMA?
RSI, MACD, Bollinger Bands, and Volume Analysis.
9. Can SMA be used in crypto trading?
Yes, it is widely used in cryptocurrency markets.
10. Can SMA guarantee profits?
No, SMA improves analysis but cannot guarantee successful trades.