
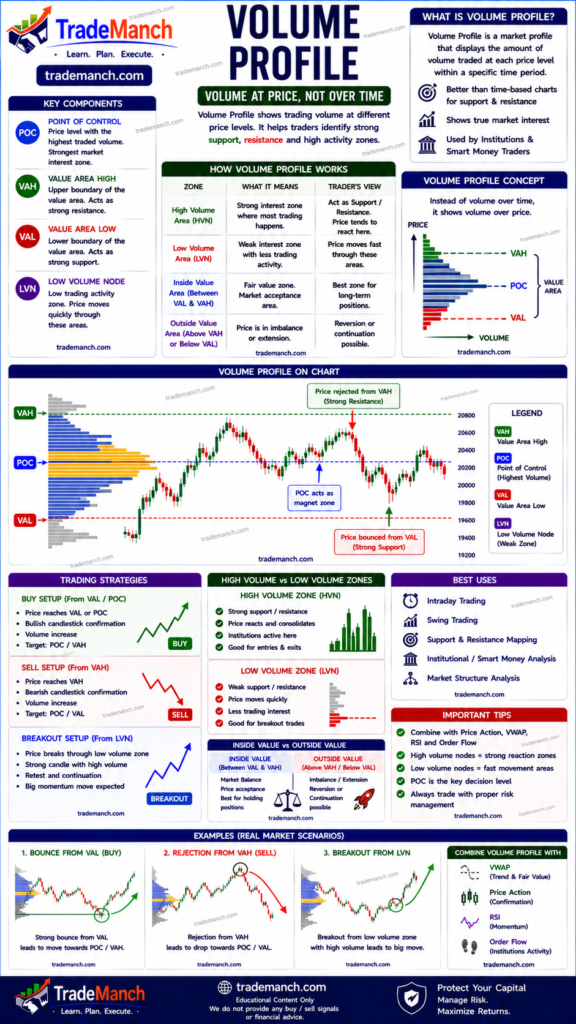
The Volume Profile is one of the most powerful advanced trading tools used by professional traders, institutions, and market analysts. Unlike traditional volume indicators that show trading volume over time, Volume Profile shows:
High-probability trading zones
Volume traded at specific price levels
Strong support zones
Strong resistance zones
Fair value areas
Institutional activity
Volume Profile is widely used in:
- Intraday trading
- Swing trading
- Futures trading
- Options trading
- Forex trading
- Cryptocurrency trading
This complete beginner-friendly guide explains everything about Volume Profile, including its components, strategies, advantages, limitations, and practical trading applications.
What Is Volume Profile?
Volume Profile is an advanced charting tool that displays the amount of trading volume executed at different price levels over a specified period.
Unlike traditional volume indicators that appear at the bottom of a chart, Volume Profile appears horizontally on the side of the chart.
It helps traders understand:
- Where buyers and sellers were most active
- Important support and resistance levels
- Fair value zones
Simple Definition of Volume Profile
Volume Profile is a trading tool that shows how much volume was traded at each price level rather than at each time period.
Why Volume Profile Is Important
Volume Profile helps traders identify:
- Institutional trading activity
- Key support levels
- Key resistance levels
- Market acceptance zones
- Market rejection zones
Professional traders often consider Volume Profile one of the most accurate support and resistance tools.
How Volume Profile Works
Volume Profile analyzes:
- Price
- Volume
and displays volume distribution across price levels.
The longer the horizontal bar:
- The more volume traded at that price
The shorter the bar:
- The less volume traded at that price
Main Components of Volume Profile
There are five important concepts:
- Point of Control (POC)
- Value Area High (VAH)
- Value Area Low (VAL)
- High Volume Node (HVN)
- Low Volume Node (LVN)
1. Point of Control (POC)
The Point of Control is:
- The price level with the highest traded volume
It represents:
- The most accepted market price
POC often acts as:
- Strong support
- Strong resistance
Why POC Matters
Institutions frequently transact near the POC.
Price often revisits this level because:
- Significant buying and selling occurred there.
2. Value Area (VA)
The Value Area contains:
- Approximately 70% of total trading volume
It represents:
- Fair value range
The market spends most of its time inside this zone.
3. Value Area High (VAH)
VAH is:
- Upper boundary of the Value Area
It often acts as:
- Resistance
4. Value Area Low (VAL)
VAL is:
- Lower boundary of the Value Area
It often acts as:
- Support
5. High Volume Node (HVN)
HVN stands for:
- High Volume Node
These are price levels where:
- Heavy trading occurred
They represent:
- Market acceptance
HVNs often become:
- Strong support
- Strong resistance
6. Low Volume Node (LVN)
LVN stands for:
- Low Volume Node
These are price levels where:
- Little trading occurred
They represent:
- Market rejection
Price often moves quickly through LVNs.
Understanding Market Acceptance
When price stays near:
- HVN
- POC
it indicates:
- Buyers and sellers agree on value
This is called:
- Market Acceptance
Understanding Market Rejection
When price quickly leaves an area:
- Low volume develops
This indicates:
- Market Rejection
Volume Profile Trading Strategies
1. POC Reversal Strategy
Buy Setup
- Price approaches POC from above
- Bullish confirmation appears
Possible support zone.
Sell Setup
- Price approaches POC from below
- Bearish confirmation appears
Possible resistance zone.
2. Value Area Trading Strategy
Buy Setup
- Price near VAL
- Bullish candlestick pattern
Possible bounce opportunity.
Sell Setup
- Price near VAH
- Bearish candlestick pattern
Possible rejection opportunity.
3. LVN Breakout Strategy
When price reaches an LVN:
- Low volume resistance exists
If breakout occurs:
- Price may move rapidly
Many traders use LVNs for:
- Breakout trades
4. HVN Support Strategy
HVNs often act as:
- Major support
- Major resistance
Traders monitor reactions near these zones.
Volume Profile and Market Structure
Volume Profile helps identify:
- Accumulation zones
- Distribution zones
- Trend continuation areas
- Reversal areas
Volume Profile in Intraday Trading
Intraday traders use:
- Daily Volume Profile
for identifying:
- Key support
- Key resistance
- Intraday targets
Popular charts:
- 5-minute
- 15-minute
Volume Profile in Swing Trading
Swing traders often use:
- Weekly Volume Profile
- Monthly Volume Profile
to identify:
- Major institutional zones
Volume Profile in Futures Trading
Volume Profile is extremely popular in:
- Index Futures
- Commodity Futures
because institutions heavily monitor volume distribution.
Volume Profile in Options Trading
Options traders use Volume Profile to:
- Identify major price levels
- Find high-probability zones
Especially useful for:
- Expiry trading
Volume Profile in Cryptocurrency Trading
Volume Profile is widely used on:
- Bitcoin
- Ethereum
because crypto markets often respect:
- High-volume zones
Volume Profile in Indian Stock Market
Popular stocks for Volume Profile analysis:
- Reliance Industries
- Infosys
- HDFC Bank
These stocks typically provide:
- Strong liquidity
- Reliable volume data
Advantages of Volume Profile
Institutional-Level Analysis
Shows where major market participants traded.
Accurate Support and Resistance
More reliable than many traditional methods.
Helps Identify Fair Value
Useful for determining market balance.
Works Across Markets
Applicable to:
- Stocks
- Forex
- Crypto
- Futures
- Commodities
Limitations of Volume Profile
Complex for Beginners
Requires understanding of volume distribution.
Not a Standalone System
Needs confirmation from:
- Price action
- Trend analysis
Platform Availability
Some advanced Volume Profile tools require premium charting software.
Common Beginner Mistakes
Ignoring Trend Direction
Always consider market trend.
Trading Every POC Touch
Not every POC reaction leads to reversal.
Ignoring Price Action
Volume Profile should be combined with candlestick analysis.
Using Volume Profile Alone
Combine with:
- RSI
- VWAP
- Moving Averages
- Price Action
Best Indicators to Combine With Volume Profile
Popular combinations:
- Volume Profile + VWAP
- Volume Profile + RSI
- Volume Profile + MACD
- Volume Profile + Price Action
- Volume Profile + Market Structure
Volume Profile + VWAP Strategy
Bullish Setup
- Price above VWAP
- Price near HVN support
Possible continuation trade.
Volume Profile + RSI Strategy
Buy Example
- Price at VAL
- RSI below 30
- Bullish candle forms
Possible reversal setup.
Volume Profile vs Traditional Volume
| Volume Profile | Traditional Volume |
|---|---|
| Volume by Price | Volume by Time |
| Horizontal Display | Vertical Display |
| Better Support/Resistance | Better Activity Measurement |
| Institutional Focus | General Volume Analysis |
Volume Profile vs VWAP
| Volume Profile | VWAP |
|---|---|
| Shows volume distribution | Shows average traded price |
| Static zones | Dynamic level |
| Strong support/resistance | Trend confirmation |
Best Timeframes for Volume Profile
| Trading Style | Timeframe |
|---|---|
| Scalping | 1-min / 5-min |
| Intraday Trading | 5-min / 15-min |
| Swing Trading | 1H / Daily |
| Positional Trading | Daily / Weekly |
Risk Management With Volume Profile
Always use:
- Stop loss
- Position sizing
- Risk-reward ratio
Example of Risk-Reward Ratio
Suppose:
- Risk = ₹20
- Target = ₹60
Risk-reward ratio:
2060=3:1
Can Volume Profile Guarantee Profits?
No.
Volume Profile helps traders:
- Understand market structure
- Identify key levels
- Improve trade planning
It cannot guarantee profitable trades.
Successful trading still requires:
- Discipline
- Patience
- Risk management
- Emotional control
How Beginners Should Learn Volume Profile
Step 1: Understand Support and Resistance
Learn basic market structure.
Step 2: Study POC, VAH, and VAL
Master the core concepts.
Step 3: Analyze Historical Charts
Observe volume distribution behavior.
Step 4: Combine With Price Action
Wait for confirmation before entering trades.
Volume Profile is one of the most advanced and effective trading tools available today. It helps traders understand where significant trading activity occurred, identify institutional price levels, and find high-probability support and resistance zones.
When combined with:
- VWAP
- RSI
- MACD
- Price Action
- Market Structure
Volume Profile can significantly improve trading decisions and market analysis.
For serious traders looking to move beyond basic indicators, Volume Profile is an essential tool worth mastering.
Frequently Asked Questions (FAQs)
1. What is Volume Profile?
Volume Profile shows trading volume at different price levels.
2. What is POC in Volume Profile?
POC (Point of Control) is the price level with the highest traded volume.
3. What is VAH?
VAH stands for Value Area High and often acts as resistance.
4. What is VAL?
VAL stands for Value Area Low and often acts as support.
5. What is HVN?
HVN means High Volume Node, indicating heavy trading activity.
6. What is LVN?
LVN means Low Volume Node, indicating low trading activity.
7. Is Volume Profile useful for intraday trading?
Yes, it is widely used by professional intraday traders.
8. Which indicators work best with Volume Profile?
VWAP, RSI, MACD, and Price Action.
9. Can beginners learn Volume Profile?
Yes, although it requires more practice than basic indicators.
10. Can Volume Profile guarantee profits?
No, it improves analysis but cannot guarantee profitable trades.