
The Ichimoku Cloud is one of the most advanced and powerful technical analysis indicators used by professional traders to identify:
- Trend direction
- Market momentum
- Support levels
- Resistance levels
- Entry points
- Exit points
- Future market outlook
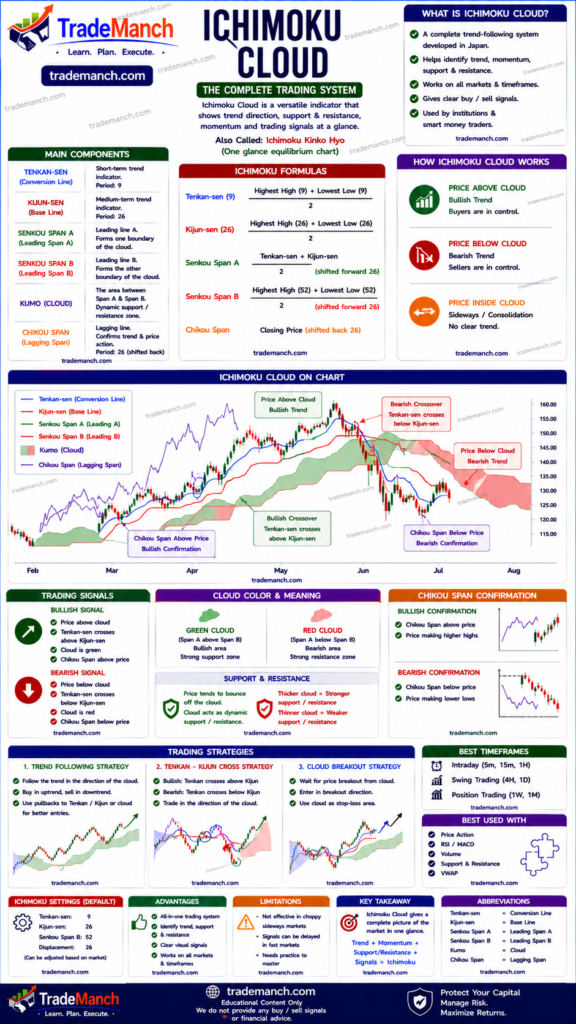
Unlike many indicators that focus on only one aspect of trading, the Ichimoku Cloud provides a complete market view in a single chart. Because of this, it is often called an all-in-one trading system.
It is widely used in:
- Stock market trading
- Forex trading
- Cryptocurrency trading
- Swing trading
- Positional trading
What Is Ichimoku Cloud?
The Ichimoku Cloud, also known as Ichimoku Kinko Hyo, is a technical analysis system that helps traders quickly identify trend direction, momentum, and support/resistance levels.
The name translates roughly to:
- “One Glance Equilibrium Chart”
because traders can analyze market conditions with a single look at the chart.
Who Created the Ichimoku Cloud?
The Ichimoku Cloud was developed by:
- Goichi Hosoda
He spent decades refining the system before releasing it publicly in the late 1960s.
Why Ichimoku Cloud Is Popular
Traders use Ichimoku because it combines:
- Trend analysis
- Momentum analysis
- Support and resistance
- Future projections
in a single indicator.
Components of Ichimoku Cloud
The Ichimoku system contains five major components:
- Tenkan-sen (Conversion Line)
- Kijun-sen (Base Line)
- Senkou Span A
- Senkou Span B
- Chikou Span
1. Tenkan-sen (Conversion Line)
Tenkan-sen represents short-term trend direction.
Formula:
Tenkan-sen=2Highest High+Lowest Low
Calculation period:
- Last 9 periods
It reacts quickly to price movement.
2. Kijun-sen (Base Line)
Kijun-sen represents medium-term trend direction.
Formula:
Kijun-sen=2Highest High+Lowest Low
Calculation period:
- Last 26 periods
It acts as:
- Trend confirmation
- Dynamic support
- Dynamic resistance
3. Senkou Span A
Leading Span A forms one side of the cloud.
Formula:
Senkou Span A=2Tenkan-sen+Kijun-sen
It is projected:
- 26 periods ahead
4. Senkou Span B
Leading Span B forms the other side of the cloud.
Formula:
Senkou Span B=2Highest High+Lowest Low
Calculation period:
- 52 periods
Projected:
- 26 periods ahead
5. Chikou Span (Lagging Span)
Chikou Span represents:
- Current closing price shifted backward
Usually:
- 26 periods back
It helps confirm:
- Trend strength
- Trade signals
What Is the Ichimoku Cloud (Kumo)?
The cloud (Kumo) is the area between:
- Senkou Span A
- Senkou Span B
The cloud is the most important part of the indicator.
Price Above the Cloud
When price is above the cloud:
- Bullish trend
- Buyers control the market
Cloud acts as:
- Support
Price Below the Cloud
When price is below the cloud:
- Bearish trend
- Sellers control the market
Cloud acts as:
- Resistance
Price Inside the Cloud
When price remains inside the cloud:
- Sideways market
- Consolidation
- Uncertain trend
Many traders avoid trading during this condition.
Understanding Cloud Colors
Green Cloud
Occurs when:
- Senkou Span A > Senkou Span B
Indicates:
- Bullish outlook
Red Cloud
Occurs when:
- Senkou Span A < Senkou Span B
Indicates:
- Bearish outlook
Ichimoku Buy Signals
1. Price Above Cloud
Strong bullish trend signal.
2. Tenkan-sen Crosses Above Kijun-sen
Bullish crossover signal.
Known as:
- TK Cross
3. Chikou Span Above Price
Confirms bullish strength.
Ichimoku Sell Signals
1. Price Below Cloud
Strong bearish trend.
2. Tenkan-sen Crosses Below Kijun-sen
Bearish crossover.
3. Chikou Span Below Price
Confirms bearish momentum.
Strongest Ichimoku Buy Signal
The strongest bullish setup occurs when:
- Price above cloud
- Tenkan above Kijun
- Chikou above price
- Green cloud
This creates multiple confirmations.
Strongest Ichimoku Sell Signal
Strong bearish setup:
- Price below cloud
- Tenkan below Kijun
- Chikou below price
- Red cloud
Kumo Breakout Strategy
One of the most popular Ichimoku strategies.
Bullish Kumo Breakout
When:
- Price breaks above cloud
Possible signal:
- New uptrend beginning
Bearish Kumo Breakout
When:
- Price breaks below cloud
Possible signal:
- New downtrend beginning
Kumo Twist
A Kumo Twist occurs when:
- Senkou Span A crosses Senkou Span B
This may indicate:
- Future trend reversal
Ichimoku Cloud in Intraday Trading
Intraday traders use:
- 5-minute chart
- 15-minute chart
for:
- Trend confirmation
- Breakout trading
- Pullback entries
However, many traders feel Ichimoku works better on higher timeframes.
Ichimoku Cloud in Swing Trading
Popular timeframes:
- 1-hour chart
- 4-hour chart
- Daily chart
These provide:
- Cleaner signals
- Stronger trend analysis
Ichimoku Cloud in Forex Trading
Ichimoku is extremely popular in forex markets because:
- Currency pairs often trend strongly
It helps identify:
- Trend continuation
- Reversal zones
Ichimoku Cloud in Cryptocurrency Trading
Popular cryptocurrencies:
- Bitcoin
- Ethereum
Crypto traders use Ichimoku because:
- Strong trends often develop
- Support and resistance levels are clear
Ichimoku Cloud in Indian Stock Market
Popular stocks for Ichimoku analysis:
- Reliance Industries
- Infosys
- HDFC Bank
These stocks often show:
- Good trend structure
- High liquidity
Advantages of Ichimoku Cloud
Complete Trading System
Provides:
- Trend
- Momentum
- Support
- Resistance
in one indicator.
Future Support and Resistance
Cloud projects levels ahead of current price.
Strong Trend Identification
Excellent for trend-following traders.
Works Across Markets
Useful in:
- Stocks
- Forex
- Crypto
- Commodities
Limitations of Ichimoku Cloud
Complex for Beginners
Contains multiple lines and signals.
Can Look Cluttered
Too much information on one chart.
False Signals in Sideways Markets
Works best during trending conditions.
Common Beginner Mistakes
Trading Inside the Cloud
Signals are weaker during consolidation.
Ignoring Trend Direction
Always trade with the larger trend.
Using Ichimoku Alone
Combine with:
- RSI
- MACD
- Volume Analysis
Best Indicators to Combine With Ichimoku
Popular combinations:
- Ichimoku + RSI
- Ichimoku + MACD
- Ichimoku + ATR
- Ichimoku + Volume Analysis
Ichimoku vs Moving Average
| Ichimoku Cloud | Moving Average |
|---|---|
| Complete trading system | Trend indicator |
| Future projections | Historical trend |
| Support + Resistance | Trend direction only |
Ichimoku vs Supertrend
| Ichimoku | Supertrend |
|---|---|
| More comprehensive | Simpler |
| Multiple confirmations | Faster signals |
| Better for higher timeframes | Popular for intraday |
Best Timeframes for Ichimoku
| Trading Style | Timeframe |
|---|---|
| Scalping | 5-min |
| Intraday Trading | 15-min |
| Swing Trading | 1H / 4H |
| Positional Trading | Daily / Weekly |
Risk Management With Ichimoku
Always use:
- Stop loss
- Position sizing
- Risk-reward ratio
Example:
- Risk = ₹20
- Target = ₹60
Risk-reward ratio:
2060=3:1
Can Ichimoku Cloud Guarantee Profits?
No.
Ichimoku only improves:
- Market analysis
- Trend identification
- Trade probability
Successful trading still requires:
- Discipline
- Risk management
- Patience
- Emotional control
The Ichimoku Cloud is one of the most advanced and complete technical analysis systems available to traders. It combines trend analysis, momentum analysis, support and resistance, and future market projections into a single indicator. Its cloud structure helps traders quickly identify market direction and potential trading opportunities.
Although it can appear complex at first, traders who master Ichimoku often find it extremely effective for trend-following strategies. When combined with proper risk management and confirmation indicators such as RSI and MACD, the Ichimoku Cloud can become a powerful tool for trading stocks, forex, and cryptocurrencies.
Frequently Asked Questions (FAQs)
1. What is Ichimoku Cloud?
Ichimoku Cloud is a technical analysis system that identifies trend direction, momentum, support, and resistance.
2. Who created Ichimoku Cloud?
It was developed by Goichi Hosoda.
3. What does price above the cloud mean?
It usually indicates a bullish trend.
4. What does price below the cloud mean?
It usually indicates a bearish trend.
5. What is Kumo in Ichimoku?
Kumo is the cloud area between Senkou Span A and Senkou Span B.
6. Is Ichimoku good for intraday trading?
Yes, but many traders prefer higher timeframes for stronger signals.
7. What is a Kumo Breakout?
A breakout above or below the cloud signaling possible trend change.
8. Which indicators work best with Ichimoku?
RSI, MACD, ATR, and Volume Analysis.
9. Can Ichimoku be used in crypto trading?
Yes, it is widely used for cryptocurrencies like Bitcoin and Ethereum.
10. Can Ichimoku Cloud guarantee profits?
No, it improves probability but cannot guarantee profitable trades.