
Pivot Points are one of the most widely used technical analysis tools for identifying:
- Support levels
- Resistance levels
- Market direction
- Entry points
- Exit points
- Intraday trading opportunities
Professional traders, institutions, and intraday traders use Pivot Points because they provide predefined price levels before the market opens.
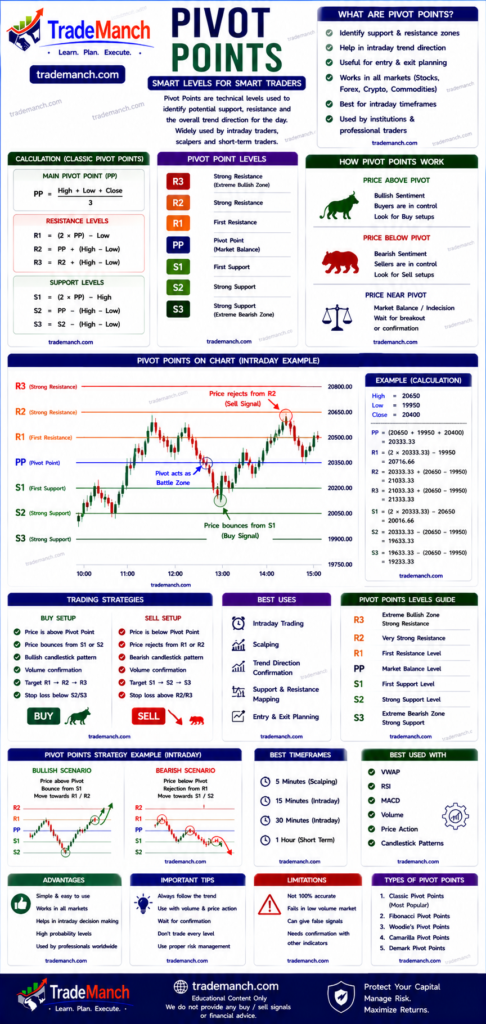
Pivot Points are especially popular in:
- Intraday trading
- Futures trading
- Options trading
- Forex trading
- Stock market trading
This complete beginner-friendly guide explains everything about Pivot Points, including formulas, calculations, strategies, advantages, limitations, and professional trading applications.
What Are Pivot Points?
Pivot Points are technical analysis levels calculated using the previous trading day’s:
- High
- Low
- Close
These levels help traders identify:
- Potential support
- Potential resistance
- Trend direction
Simple Definition of Pivot Points
Pivot Points are price levels used to determine market support, resistance, and trend direction for the current trading session.
Why Pivot Points Are Important
Pivot Points help traders:
- Plan trades before market opens
- Identify entry zones
- Find target levels
- Manage risk
- Understand market sentiment
Basic Pivot Point Formula
The main Pivot Point (PP) is calculated as:
PP=3High+Low+Close
Where:
- High = Previous day’s high
- Low = Previous day’s low
- Close = Previous day’s closing price
Pivot Point Structure
After calculating the Pivot Point, traders calculate:
Support Levels
- S1
- S2
- S3
Resistance Levels
- R1
- R2
- R3
Resistance Formulas
First Resistance (R1)
R1=(2×PP)−Low
Second Resistance (R2)
R2=PP+(High−Low)
Support Formulas
First Support (S1)
S1=(2×PP)−High
Second Support (S2)
S2=PP−(High−Low)
Understanding Pivot Levels
| Level | Meaning |
|---|---|
| PP | Main Pivot |
| R1 | First Resistance |
| R2 | Second Resistance |
| R3 | Strong Resistance |
| S1 | First Support |
| S2 | Second Support |
| S3 | Strong Support |
How Pivot Points Work
Pivot Points act as:
- Dynamic support levels
- Dynamic resistance levels
Traders monitor price reaction around these levels.
Market Above Pivot Point
When price remains above Pivot Point:
- Bullish sentiment
- Buyers dominate
- Uptrend possibility
Market Below Pivot Point
When price remains below Pivot Point:
- Bearish sentiment
- Sellers dominate
- Downtrend possibility
Pivot Point Trading Strategies
1. Pivot Breakout Strategy
Buy Setup
- Price breaks above Pivot Point
- Strong volume appears
Possible target:
- R1
- R2
Sell Setup
- Price breaks below Pivot Point
Possible target:
- S1
- S2
2. Pivot Reversal Strategy
Buy Setup
- Price touches S1 or S2
- Bullish reversal candle forms
Possible bounce opportunity.
Sell Setup
- Price touches R1 or R2
- Bearish reversal candle forms
Possible rejection opportunity.
3. Pivot Trend Strategy
Bullish Trend
- Price consistently above PP
Focus:
- Buy opportunities
Bearish Trend
- Price consistently below PP
Focus:
- Sell opportunities
Example of Pivot Point Calculation
Suppose previous day:
- High = ₹110
- Low = ₹90
- Close = ₹100
Pivot Point:
PP=3110+90+100=100
Main Pivot = ₹100
Why Intraday Traders Love Pivot Points
Advantages:
- Pre-calculated levels
- Clear trade planning
- Easy support/resistance identification
- Works well with price action
Pivot Points in Intraday Trading
Popular chart timeframes:
- 5-minute chart
- 15-minute chart
Intraday traders often combine:
- Pivot Points
- Volume analysis
- Candlestick patterns
Pivot Points in Swing Trading
Swing traders use:
- Weekly Pivot Points
- Monthly Pivot Points
to identify:
- Medium-term support
- Resistance zones
Types of Pivot Points
Standard Pivot Points
Most widely used method.
Fibonacci Pivot Points
Uses Fibonacci ratios.
Popular among:
- Swing traders
Camarilla Pivot Points
Provides:
- Tighter support and resistance levels
Popular among:
- Scalpers
Woodie Pivot Points
Gives greater importance to:
- Closing price
Advantages of Pivot Points
Easy to Use
Simple calculations.
Clear Support and Resistance
Provides predefined levels.
Useful for Intraday Trading
Excellent for short-term traders.
Objective Analysis
Removes emotional bias.
Limitations of Pivot Points
Not Always Accurate
Price may ignore Pivot levels.
Best in Active Markets
Less effective during:
- Extremely low volume
- Flat markets
Requires Confirmation
Always combine with:
- Price action
- Volume
- Trend analysis
Common Beginner Mistakes With Pivot Points
Trading Every Pivot Touch
Not all reactions are significant.
Ignoring Volume
Volume confirmation is important.
Ignoring Trend Direction
Trend matters more than individual levels.
Using Pivot Points Alone
Combine with:
- RSI
- MACD
- VWAP
- Candlestick patterns
Best Indicators to Combine With Pivot Points
Popular combinations:
- Pivot Points + RSI
- Pivot Points + MACD
- Pivot Points + VWAP
- Pivot Points + Supertrend
Pivot Points + RSI Strategy
Buy Example
- Price near S1
- RSI below 30
- Bullish candle appears
Possible reversal setup.
Pivot Points + VWAP Strategy
Bullish Setup
- Price above VWAP
- Price above Pivot Point
Strong bullish confirmation.
Pivot Points in Cryptocurrency Trading
Many crypto traders use Pivot Points for:
- Bitcoin
- Ethereum
because crypto markets:
- Respect support and resistance levels
- Experience strong volatility
Pivot Points in Indian Stock Market
Popular stocks for Pivot Point analysis:
- Reliance Industries
- Infosys
- HDFC Bank
These stocks often show:
- Strong liquidity
- Clear reactions to support and resistance
Best Timeframes for Pivot Points
| Trading Style | Timeframe |
|---|---|
| Scalping | 1-min / 5-min |
| Intraday Trading | 5-min / 15-min |
| Swing Trading | 1-hour / Daily |
| Positional Trading | Daily / Weekly |
Risk Management While Using Pivot Points
Always use:
- Stop loss
- Position sizing
- Risk-reward ratio
Example of Risk-Reward Ratio
Suppose:
- Risk = ₹10
- Target = ₹30
Risk-reward ratio:
1030=3:1
Can Pivot Points Guarantee Profits?
No.
Pivot Points cannot guarantee profits.
They only help traders:
- Identify important price levels
- Improve trade planning
- Understand market structure
Successful trading still requires:
- Discipline
- Risk management
- Patience
How Beginners Should Learn Pivot Points
Step 1: Understand Support and Resistance
Master basic price levels.
Step 2: Learn Pivot Calculations
Understand PP, S1, S2, R1, and R2.
Step 3: Practice Chart Analysis
Observe how price reacts around Pivot levels.
Step 4: Combine With Other Indicators
Use confirmation tools before entering trades.
Pivot Points are one of the most effective support and resistance tools used by traders worldwide. They provide clear price levels that help identify market direction, entry points, exit points, and potential reversal zones.
They are particularly useful for:
- Intraday traders
- Scalpers
- Options traders
However, Pivot Points should never be used alone. Successful traders combine them with:
- RSI
- MACD
- VWAP
- Candlestick patterns
- Risk management
With practice and discipline, Pivot Points can become a valuable part of any trader’s technical analysis toolkit.
Frequently Asked Questions (FAQs)
1. What are Pivot Points?
Pivot Points are support and resistance levels calculated from previous price data.
2. Why are Pivot Points important?
They help identify market direction and trading opportunities.
3. Are Pivot Points good for intraday trading?
Yes, they are widely used by intraday traders.
4. What is the Pivot Point formula?
The main Pivot Point is calculated using High, Low, and Close prices.
5. What are R1 and S1?
R1 is the first resistance level and S1 is the first support level.
6. Do Pivot Points work in stocks?
Yes, they are widely used in stock trading.
7. Can Pivot Points be used in crypto?
Yes, they are commonly used in crypto markets.
8. Which indicators work best with Pivot Points?
RSI, MACD, VWAP, and Supertrend.
9. Can beginners use Pivot Points?
Yes, they are beginner-friendly and easy to understand.
10. Can Pivot Points guarantee profits?
No, they only improve analysis and trade planning.