
The Parabolic SAR (Stop and Reverse) is one of the most popular trend-following indicators used by traders to identify:
- Trend direction
- Potential trend reversals
- Entry signals
- Exit signals
- Trailing stop-loss levels
Parabolic SAR is widely used in:
- Intraday trading
- Swing trading
- Forex trading
- Cryptocurrency trading
- Stock market trading
This complete beginner-friendly guide explains everything about the Parabolic SAR indicator, including its formula, settings, strategies, advantages, limitations, and practical trading applications.
What Is Parabolic SAR?
Parabolic SAR stands for:
- Stop And Reverse
It was developed by:
- J. Welles Wilder Jr.
The indicator appears as a series of dots placed:
- Above price during a downtrend
- Below price during an uptrend
Simple Definition of Parabolic SAR
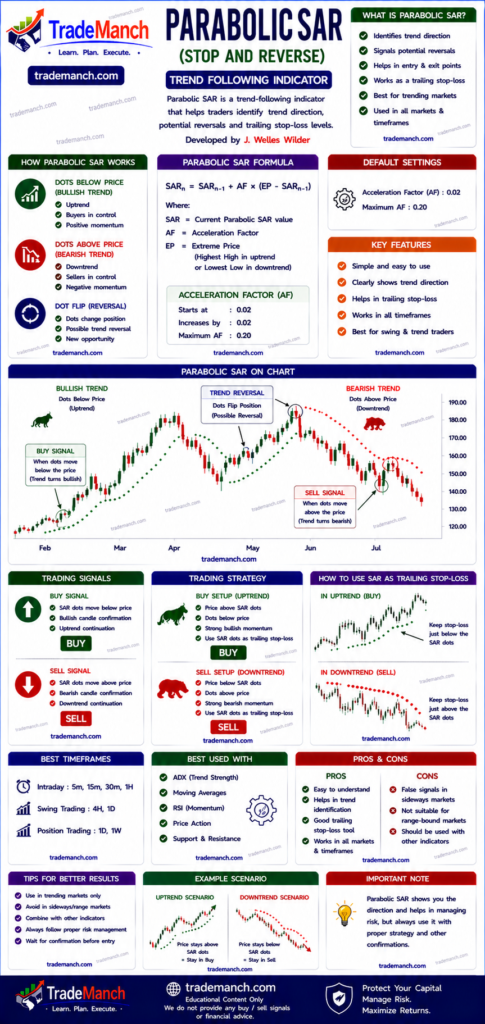
Parabolic SAR is a trend-following indicator that helps traders identify the direction of a trend and potential reversal points.
Why Is It Called Stop and Reverse?
The indicator is designed to:
- Exit a trade when the trend weakens
- Reverse the trading direction when a new trend starts
Hence the name:
- Stop And Reverse (SAR)
How Parabolic SAR Works
The indicator places dots around price movement.
Dots Below Price
When dots appear below candles:
- Market is considered bullish
- Uptrend is active
Possible interpretation:
- Buy-side momentum is strong
Dots Above Price
When dots appear above candles:
- Market is considered bearish
- Downtrend is active
Possible interpretation:
- Selling pressure is dominant
Parabolic SAR Formula
The basic formula is:
SARnext=SARcurrent+AF(EP−SARcurrent)
Where:
- SAR = Stop and Reverse value
- AF = Acceleration Factor
- EP = Extreme Point
What Is Acceleration Factor (AF)?
Acceleration Factor determines:
- Indicator sensitivity
Default values:
- Starting AF = 0.02
- Maximum AF = 0.20
Higher AF:
- Faster signals
- More false signals
Lower AF:
- Slower signals
- Fewer false signals
What Is Extreme Point (EP)?
Extreme Point represents:
- Highest high during uptrend
- Lowest low during downtrend
Default Parabolic SAR Settings
Most trading platforms use:
- Step = 0.02
- Maximum Step = 0.20
These are the most common settings.
Understanding Parabolic SAR Signals
Buy Signal
A buy signal occurs when:
- Dots move from above price to below price
This indicates:
- Potential bullish trend reversal
Sell Signal
A sell signal occurs when:
- Dots move from below price to above price
This indicates:
- Potential bearish trend reversal
Example of Buy Signal
Suppose:
- Price was falling
- Dots were above candles
- Dots suddenly move below candles
Possible interpretation:
- New uptrend may begin
Example of Sell Signal
Suppose:
- Price was rising
- Dots were below candles
- Dots suddenly move above candles
Possible interpretation:
- New downtrend may begin
Parabolic SAR and Trend Following
Parabolic SAR works best when:
- Market is trending strongly
It helps traders:
- Stay with the trend
- Avoid exiting too early
Using Parabolic SAR as Trailing Stop Loss
Many traders use SAR dots as:
- Dynamic stop-loss levels
Bullish Trade Example
As price rises:
- SAR dots continue moving higher
Stop-loss can be shifted below new SAR dots.
Bearish Trade Example
As price falls:
- SAR dots move lower
Stop-loss can trail above SAR dots.
Parabolic SAR Trading Strategies
1. Basic Parabolic SAR Strategy
Buy Setup
- Dots move below price
- Trend confirmation appears
Sell Setup
- Dots move above price
- Trend weakness appears
2. Parabolic SAR + Moving Average Strategy
Many traders combine SAR with:
- 50 EMA
- 200 EMA
Bullish Setup
- Price above 200 EMA
- SAR bullish signal
This provides stronger confirmation.
3. Parabolic SAR + RSI Strategy
Popular combination:
- SAR identifies trend
- RSI confirms momentum
Buy Example
- SAR bullish
- RSI above 50
Sell Example
- SAR bearish
- RSI below 50
4. Parabolic SAR + MACD Strategy
Many traders combine:
- SAR reversal signals
- MACD crossover signals
This reduces false entries.
Parabolic SAR in Intraday Trading
Intraday traders use SAR for:
- Trend-following trades
- Quick entries
- Scalping opportunities
Popular timeframes:
- 5-minute chart
- 15-minute chart
Parabolic SAR in Swing Trading
Swing traders often use:
- 1-hour chart
- 4-hour chart
- Daily chart
to capture:
- Medium-term trends
Best Timeframes for Parabolic SAR
| Trading Style | Timeframe |
|---|---|
| Scalping | 1-min / 5-min |
| Intraday Trading | 5-min / 15-min |
| Swing Trading | 1-hour / Daily |
| Positional Trading | Daily / Weekly |
Advantages of Parabolic SAR
Easy to Understand
Very beginner-friendly.
Clear Buy and Sell Signals
Provides simple visual signals.
Excellent Trailing Stop Tool
Helps lock in profits.
Good Trend Identification
Works well in trending markets.
Limitations of Parabolic SAR
Poor Performance in Sideways Markets
SAR may generate many false signals during:
- Consolidation
- Range-bound markets
Frequent Whipsaws
Rapid signal changes can occur during choppy conditions.
Not Accurate Alone
Should be combined with:
- Trend analysis
- Support and resistance
- Risk management
Common Beginner Mistakes With Parabolic SAR
Trading Every Signal
Not all SAR reversals are reliable.
Ignoring Market Trend
Always identify the larger trend.
Using SAR Alone
Combine with:
- RSI
- MACD
- Moving averages
Ignoring Stop Loss
Risk management remains essential.
Best Indicators to Combine With Parabolic SAR
Popular combinations:
- Parabolic SAR + RSI
- Parabolic SAR + MACD
- Parabolic SAR + Moving Average
- Parabolic SAR + Supertrend
Parabolic SAR vs Supertrend
| Parabolic SAR | Supertrend |
|---|---|
| Dot-based indicator | Line-based indicator |
| Faster signals | Smoother signals |
| More sensitive | Fewer false signals |
Parabolic SAR vs Moving Average
| Parabolic SAR | Moving Average |
|---|---|
| Reversal-focused | Trend-focused |
| Dynamic stop-loss | Trend direction |
| Faster response | Slower response |
Parabolic SAR in Cryptocurrency Trading
SAR is widely used in cryptocurrencies such as:
- Bitcoin
- Ethereum
because crypto markets often show:
- Strong trends
- High volatility
Parabolic SAR in Indian Stock Market
Popular stocks for SAR analysis include:
- Reliance Industries
- Infosys
- HDFC Bank
These stocks typically offer:
- High liquidity
- Consistent trend behavior
Best Market Conditions for Parabolic SAR
Parabolic SAR works best in:
- Strong uptrends
- Strong downtrends
It performs poorly during:
- Sideways markets
- Low-volatility consolidation
Risk Management While Using Parabolic SAR
Always use:
- Stop loss
- Position sizing
- Risk-reward ratio
Example of Risk-Reward Ratio
Suppose:
- Risk = ₹20
- Target = ₹60
Risk-reward ratio:
2060=3:1
Can Parabolic SAR Guarantee Profits?
No indicator guarantees profits.
Parabolic SAR only helps improve:
- Trend identification
- Trade timing
- Market analysis
Successful trading still requires:
- Discipline
- Risk management
- Patience
- Emotional control
How Beginners Should Learn Parabolic SAR
Step 1: Understand Trend Basics
Learn:
- Uptrends
- Downtrends
- Market structure
Step 2: Practice on Charts
Study historical SAR reversals.
Step 3: Combine With Confirmation Indicators
Avoid relying solely on SAR.
Step 4: Use Demo Trading
Practice before using real capital.
Parabolic SAR is one of the most effective trend-following indicators for identifying market direction, reversals, and trailing stop-loss opportunities. Its simple dot-based structure makes it popular among beginners and professional traders alike.
However, it works best in trending markets and should be combined with:
- RSI
- MACD
- Moving averages
- Price action
- Risk management
With proper practice and discipline, Parabolic SAR can become a valuable tool for improving trading decisions and managing risk effectively.
Frequently Asked Questions (FAQs)
1. What is Parabolic SAR?
Parabolic SAR is a trend-following indicator used to identify trend direction and reversals.
2. Who created Parabolic SAR?
It was developed by J. Welles Wilder Jr..
3. What does SAR stand for?
SAR stands for Stop And Reverse.
4. What does it mean when dots are below price?
It generally indicates a bullish trend.
5. What does it mean when dots are above price?
It generally indicates a bearish trend.
6. Is Parabolic SAR good for intraday trading?
Yes, it is widely used by intraday traders.
7. What is the default Parabolic SAR setting?
Most platforms use Step 0.02 and Maximum Step 0.20.
8. Which indicators work best with Parabolic SAR?
RSI, MACD, Moving Averages, and Supertrend.
9. Does Parabolic SAR work in crypto trading?
Yes, it is commonly used in cryptocurrency markets.
10. Can Parabolic SAR guarantee profits?
No, it improves probability but cannot guarantee profitable trades.