
RSI (Relative Strength Index) is one of the most popular and widely used technical indicators in the stock market. Traders use RSI to identify:
- Overbought conditions
- Oversold conditions
- Trend strength
- Momentum shifts
- Possible reversals
RSI is commonly used in:
- Intraday trading
- Swing trading
- Forex trading
- Cryptocurrency trading
- Options trading
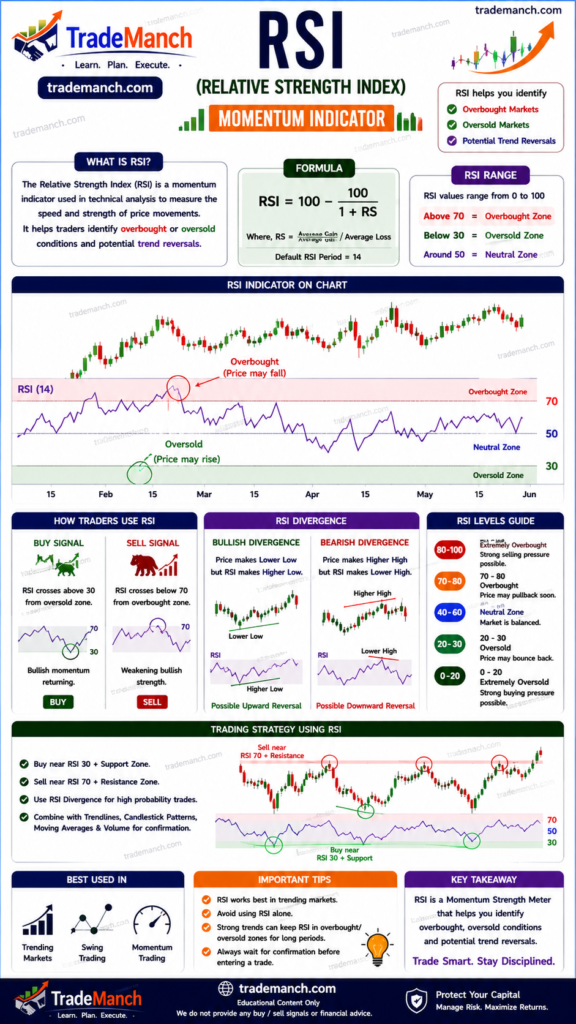
This complete beginner-friendly guide explains everything about RSI, including strategies, formulas, advantages, limitations, and professional usage.
What Is RSI?
RSI stands for:
- Relative Strength Index
It is a momentum indicator developed by:
- J. Welles Wilder Jr.
RSI measures:
- Speed of price movement
- Strength of market momentum
Simple Definition of RSI
RSI is a technical indicator that measures whether a stock or asset is overbought or oversold.
RSI Range
RSI moves between:
- 0 and 100
RSI Formula
RSI=100−1+RS100
Where:
- RS = Average Gain / Average Loss
Standard RSI Setting
Most traders use:
- 14-period RSI
This is the default and most commonly used setting.
How RSI Works
RSI measures momentum strength based on recent price movement.
RSI Above 70
Indicates:
- Overbought condition
Meaning:
- Price may be too high
- Possible correction or pullback
RSI Below 30
Indicates:
- Oversold condition
Meaning:
- Price may be too low
- Possible upward reversal
Example of RSI
If RSI rises to:
- 75 → Market may be overheated.
- 25 → Market may be oversold.
Understanding RSI Zones
| RSI Level | Meaning |
|---|---|
| Above 70 | Overbought |
| Below 30 | Oversold |
| Around 50 | Neutral trend |
What Is Overbought?
Overbought means:
- Price has risen too quickly
- Buyers may be exhausted
This may lead to:
- Consolidation
- Price correction
What Is Oversold?
Oversold means:
- Price has fallen too quickly
- Selling pressure may weaken
This may lead to:
- Bounce
- Trend reversal
RSI Buy Signal
Common bullish signal:
- RSI moves above 30 from oversold zone.
This suggests:
- Buyers may be returning.
RSI Sell Signal
Common bearish signal:
- RSI falls below 70 from overbought zone.
This suggests:
- Selling pressure may increase.
RSI and Trend Strength
RSI also helps identify trend strength.
Strong Bullish Trend
In strong uptrends:
- RSI may remain between 40–80.
Strong Bearish Trend
In downtrends:
- RSI may remain between 20–60.
Why RSI Is Popular
RSI is popular because:
- Easy to understand
- Beginner-friendly
- Useful in multiple markets
- Effective for momentum analysis
RSI Divergence
Divergence is an advanced RSI concept.
It occurs when:
- Price and RSI move differently.
Bullish Divergence
Price:
- Makes lower low
RSI:
- Makes higher low
This may signal:
- Possible bullish reversal
Bearish Divergence
Price:
- Makes higher high
RSI:
- Makes lower high
This may signal:
- Possible bearish reversal
RSI Trading Strategies
1. RSI Overbought/Oversold Strategy
Buy Setup
- RSI below 30
- RSI starts moving upward
Sell Setup
- RSI above 70
- RSI starts moving downward
2. RSI Trend Confirmation Strategy
Bullish Trend
- RSI above 50
Bearish Trend
- RSI below 50
Many traders use RSI 50 level for trend confirmation.
3. RSI Divergence Strategy
Used for:
- Reversal trading
Traders look for:
- Bullish divergence
- Bearish divergence
4. RSI + Moving Average Strategy
Popular combination:
- RSI confirms momentum
- Moving average confirms trend
Example Setup
Buy Conditions
- Price above 50 EMA
- RSI above 50
This confirms:
- Bullish momentum
Best RSI Settings for Different Trading Styles
| Trading Style | RSI Setting |
|---|---|
| Intraday Trading | 9 or 14 |
| Swing Trading | 14 |
| Long-Term Analysis | 14 or 21 |
RSI in Intraday Trading
Intraday traders use RSI for:
- Quick reversals
- Momentum trading
- Scalping
Popular timeframes:
- 5-minute chart
- 15-minute chart
RSI in Swing Trading
Swing traders use RSI on:
- 1-hour chart
- Daily chart
to identify:
- Trend continuation
- Reversals
RSI in Cryptocurrency Trading
RSI is widely used in crypto markets like:
- Bitcoin
- Ethereum
because crypto markets are highly volatile.
RSI in Stock Trading
Popular Indian stocks where traders use RSI:
- Reliance Industries
- Infosys
- HDFC Bank
Advantages of RSI
Easy to Use
Simple for beginners.
Momentum Analysis
Shows market strength clearly.
Helps Detect Reversals
Useful in identifying potential turning points.
Works in Multiple Markets
Applicable in:
- Stocks
- Forex
- Crypto
- Commodities
Limitations of RSI
False Signals
RSI may stay overbought or oversold for long periods during strong trends.
Not Accurate Alone
RSI should not be used without:
- Trend analysis
- Support/resistance
- Risk management
Lagging Nature
Like most indicators, RSI uses past price data.
Common Beginner Mistakes With RSI
Blindly Buying Below 30
Oversold does not guarantee immediate reversal.
Blindly Selling Above 70
Strong trends may continue higher.
Ignoring Market Trend
Trend direction is extremely important.
Using RSI Alone
Combine RSI with:
- Price action
- Volume
- Support and resistance
Best RSI Combination Indicators
Popular combinations:
- RSI + Moving Average
- RSI + MACD
- RSI + Price Action
- RSI + Volume Analysis
Risk Management While Using RSI
Always use:
- Stop loss
- Position sizing
- Proper risk-reward ratio
Example of Risk-Reward Ratio
Suppose:
- Risk = ₹10
- Target = ₹30
Risk-reward ratio:
1030=3:1
RSI vs MACD
| RSI | MACD |
|---|---|
| Momentum indicator | Trend-following indicator |
| Shows overbought/oversold | Shows trend direction |
| Faster signals | Smoother signals |
Many traders use both together.
RSI vs Stochastic Indicator
Both are momentum indicators.
RSI:
- Simpler and more popular.
Stochastic:
- More sensitive to short-term movement.
Best Timeframe for RSI Beginners
Beginners often prefer:
- 15-minute chart
- 1-hour chart
- Daily chart
These timeframes reduce market noise.
Can RSI Guarantee Profits?
No indicator guarantees profits.
RSI only improves:
- Probability
- Trade analysis
- Momentum understanding
Successful trading still requires:
- Discipline
- Risk management
- Experience
How Beginners Should Learn RSI
Step 1: Understand RSI Basics
Learn:
- Overbought
- Oversold
- Momentum
Step 2: Practice on Charts
Analyze historical RSI movement.
Step 3: Combine With Trend Analysis
Avoid isolated signals.
Step 4: Use Demo Trading
Practice before risking real money.
RSI is one of the most useful and beginner-friendly indicators in technical analysis. It helps traders identify momentum, overbought conditions, oversold conditions, and possible reversals.
However, RSI should not be used alone. Successful traders combine RSI with:
- Trend analysis
- Price action
- Support and resistance
- Risk management
With practice and discipline, RSI can become a powerful tool for improving trading decisions in stocks, forex, crypto, and other financial markets.
Frequently Asked Questions (FAQs)
1. What is RSI in trading?
RSI is a momentum indicator used to measure overbought and oversold conditions.
2. Who created RSI?
RSI was developed by J. Welles Wilder Jr..
3. What does RSI above 70 mean?
It usually indicates overbought conditions.
4. What does RSI below 30 mean?
It usually indicates oversold conditions.
5. What is the best RSI setting?
14-period RSI is the most commonly used setting.
6. Can RSI be used for intraday trading?
Yes, RSI is widely used in intraday trading.
7. Is RSI accurate?
RSI improves probability but does not guarantee profits.
8. What is RSI divergence?
When price and RSI move differently, signaling possible reversal.
9. Can beginners use RSI?
Yes, RSI is beginner-friendly and easy to learn.
10. Should RSI be used alone?
No, RSI works better with trend analysis and risk management.