🔍 What is a Hanging Man Pattern?
The Hanging Man candlestick pattern is a bearish reversal signal that appears at the top of an uptrend. It looks similar to a Hammer, but its meaning is completely different because of where it forms
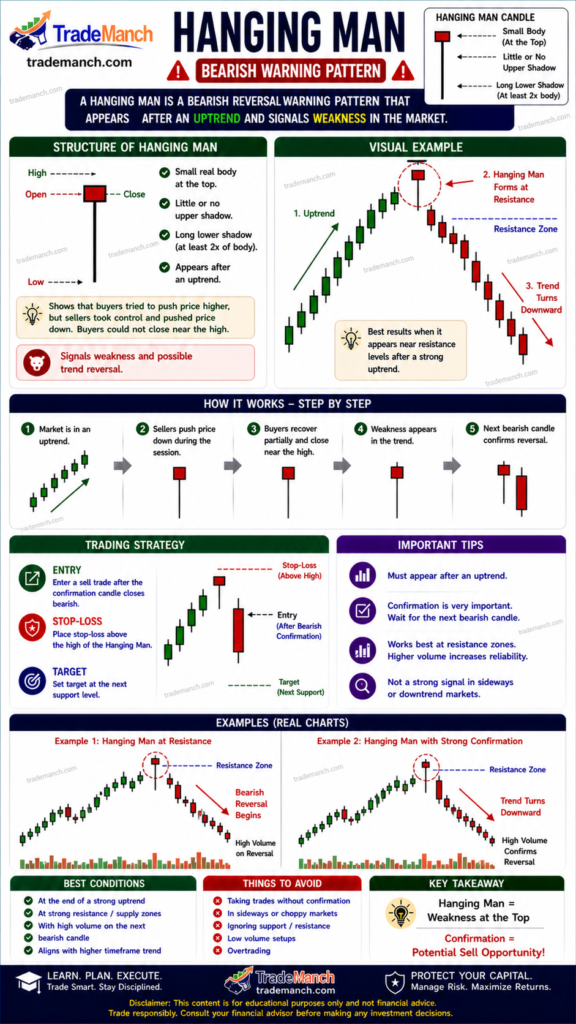
👉 It signals weakness in the uptrend and warns that a downward reversal may occur.
📈 Key Features of Hanging Man
- 🔴 or 🟢 Small real body near the top
- 📉 Long lower shadow (at least 2x the body)
- ❌ Little or no upper shadow
- 📍 Appears after a strong uptrend
💡 Psychology Behind the Pattern
The Hanging Man reflects hidden weakness:
- Buyers push price up initially
- Sellers suddenly drive price down sharply
- Price recovers slightly but closes near the open
👉 This shows selling pressure is entering the market, even though the trend was bullish.
✅ How to Trade the Hanging Man
🔹 Step-by-Step Strategy:
- Confirm Uptrend
Ensure the market has been rising. - Identify the Hanging Man Candle
Look for a small body with a long lower wick. - Wait for Confirmation
Enter only if the next candle closes bearish. - Entry Point
Sell below the low of the Hanging Man candle. - Stop Loss
Place above the high of the candle. - Target
Use support levels or a 1:2 risk-reward ratio.
⚠️ Common Mistakes to Avoid
- ❌ Confusing with Hammer (trend context matters)
- ❌ Trading without confirmation
- ❌ Ignoring resistance zones
- ❌ Using it in sideways markets
🔗 Hanging Man vs Hammer
| Pattern | Trend Context | Signal Type |
|---|---|---|
| Hanging Man | Uptrend | Bearish |
| Hammer | Downtrend | Bullish |
👉 Same structure, different meaning based on trend location.
🚀 Pro Tips for Better Accuracy
- Combine with Resistance Levels
- Use RSI (overbought zone)
- Watch for volume spike
- Confirm with trendline breakdown
The Hanging Man pattern acts as an early warning signal that the uptrend may be losing strength. It doesn’t guarantee a reversal—but when confirmed, it can help traders exit long positions or take short trades early.