🔍 What is a Morning Star Pattern?
The Morning Star candlestick pattern is a 3-candle bullish reversal pattern that appears after a downtrend. It signals that selling pressure is fading and buyers are starting to take control.
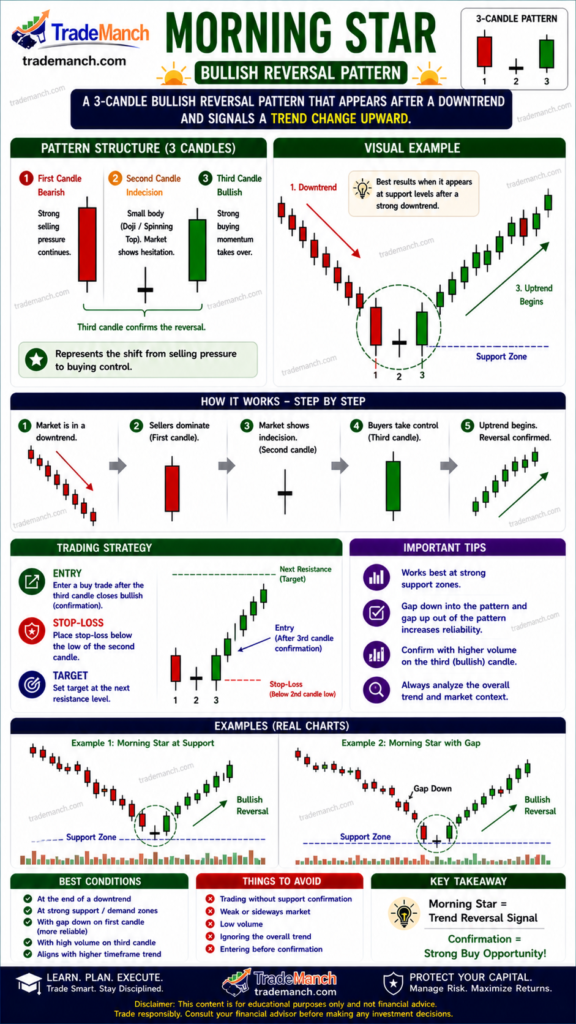
👉 This pattern indicates a potential trend reversal upward.
📈 Structure of the Morning Star
The pattern consists of three candles:
- 🔴 First Candle (Bearish)
A strong red candle showing continued selling. - ⭐ Second Candle (Indecision)
A small-bodied candle (Doji or spinning top) showing market hesitation. - 🟢 Third Candle (Bullish)
A strong green candle that closes well into the first candle’s body.
💡 Psychology Behind the Pattern
- Sellers dominate initially (downtrend continues)
- Market pauses (indecision phase)
- Buyers take control strongly
👉 This shift shows that bearish momentum is weakening and bullish momentum is building.
✅ How to Trade the Morning Star
🔹 Step-by-Step Strategy:
- Confirm Downtrend
Ensure the market is falling before the pattern forms. - Identify the 3-Candle Formation
Look for bearish → indecision → bullish sequence. - Wait for Confirmation
Enter after the third candle closes bullish. - Entry Point
Buy above the high of the third candle. - Stop Loss
Place below the low of the pattern. - Target
Use resistance levels or a 1:2 risk-reward ratio.
⚠️ Common Mistakes to Avoid
- ❌ Ignoring the downtrend context
- ❌ Weak third candle (low momentum)
- ❌ Skipping confirmation
- ❌ Not using support levels
🔗 Morning Star vs Evening Star
| Pattern | Trend Context | Signal Type |
|---|---|---|
| Morning Star | Downtrend | Bullish |
| Evening Star | Uptrend | Bearish |
🚀 Pro Tips for Better Accuracy
- Combine with Support Zones
- Use RSI (oversold condition)
- Look for volume increase on 3rd candle
- Confirm with trendline breakout
The Morning Star pattern is one of the most reliable trend reversal signals in technical analysis. Its three-candle structure clearly shows a shift from selling pressure to buying strength.