🔍 What is a Doji Pattern?
The Doji candlestick pattern represents market indecision, where buyers and sellers are equally strong. It forms when the opening price and closing price are nearly the same.
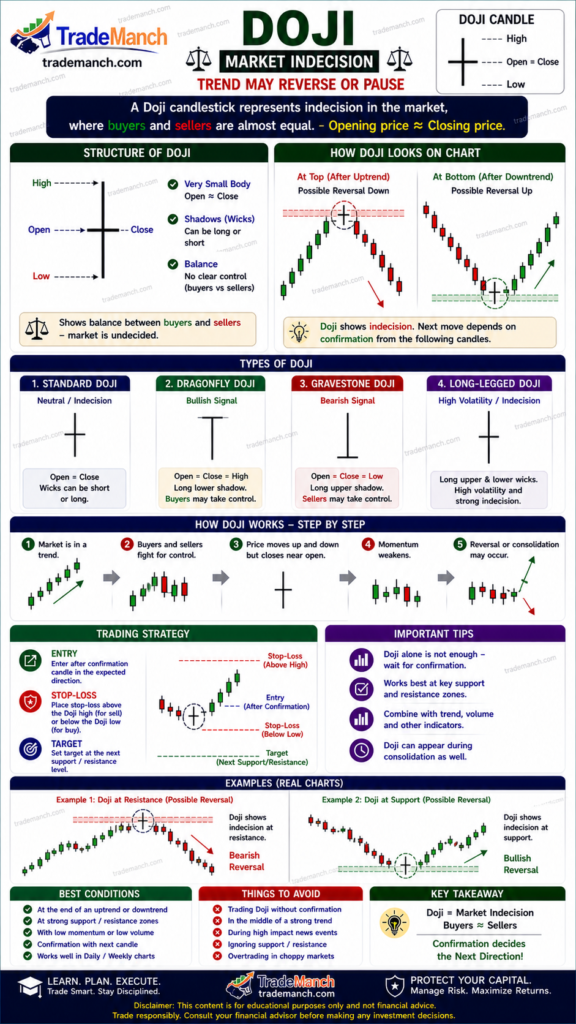
👉 This signals that the current trend may pause or reverse, depending on confirmation.
📈 Key Features of a Doji Candle
- ➖ Very small or no real body
- 📊 Open ≈ Close price
- 📉 Upper and lower shadows may vary
- 📍 Can appear in uptrend or downtrend
🔄 Types of Doji Patterns
- Standard Doji – Balanced indecision
- Long-Legged Doji – High volatility, strong indecision
- Dragonfly Doji – Bullish signal (long lower shadow)
- Gravestone Doji – Bearish signal (long upper shadow)
💡 Psychology Behind the Doji
The Doji reflects a tug-of-war between buyers and sellers:
- Buyers push price up
- Sellers push price down
- Price closes near the opening
👉 Result: No clear winner, signaling uncertainty in the market.
✅ How to Trade the Doji Pattern
🔹 Strategy:
- Identify the Trend
Check if the market is in an uptrend or downtrend. - Spot the Doji Candle
Look for a near-equal open and close. - Wait for Confirmation
The next candle decides direction. - Entry Point
- Buy above Doji high (bullish confirmation)
- Sell below Doji low (bearish confirmation)
- Stop Loss
- Below low (buy trade)
- Above high (sell trade)
⚠️ Common Mistakes to Avoid
- ❌ Trading Doji without confirmation
- ❌ Ignoring trend context
- ❌ Confusing with spinning top (slightly bigger body)
- ❌ Using it alone without indicators
🔗 Doji vs Spinning Top
| Pattern | Body Size | Signal Strength |
|---|---|---|
| Doji | Very small | Strong indecision |
| Spinning Top | Small | Mild indecision |
🚀 Pro Tips for Better Accuracy
- Combine with Support & Resistance
- Use RSI (overbought/oversold levels)
- Check volume for confirmation
- Watch for trend reversal zones
The Doji candlestick pattern is a crucial signal of market hesitation. It doesn’t confirm direction on its own—but when combined with trend analysis and confirmation candles, it becomes a powerful trading tool.