
The Bullish Engulfing Pattern is one of the most popular and reliable bullish reversal candlestick patterns in technical analysis. It often appears after a downtrend and signals that buyers have gained control of the market, potentially leading to an upward price movement.
Traders use the Bullish Engulfing pattern to identify trend reversals, buying opportunities, and potential market bottoms. When combined with support levels, volume analysis, and technical indicators, it can provide high-probability trading setups.
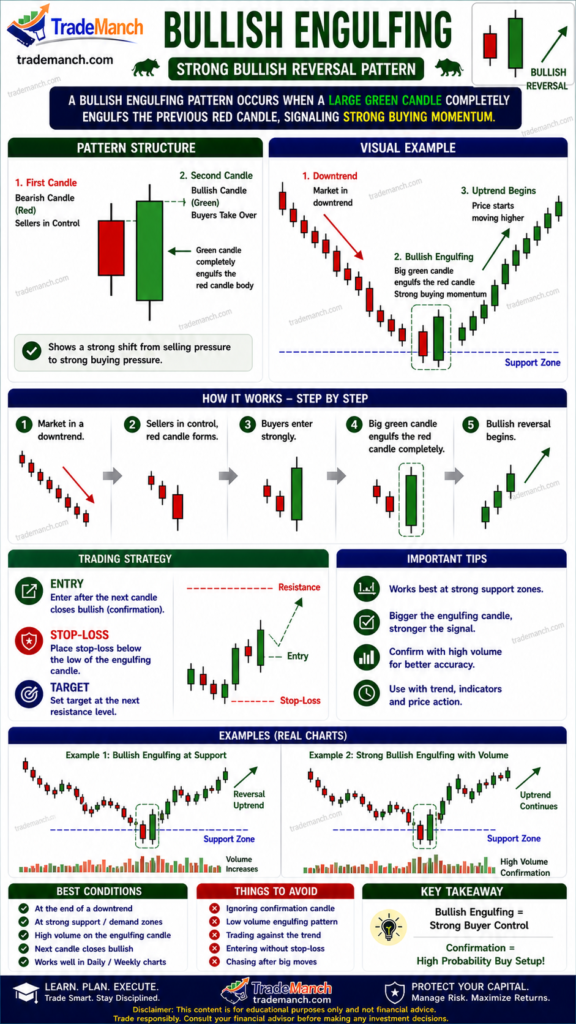
This guide explains the Bullish Engulfing Pattern in simple language with practical examples and trading strategies.
What Is a Bullish Engulfing Pattern?
A Bullish Engulfing Pattern is a two-candlestick bullish reversal pattern that forms after a downtrend.
The pattern consists of:
- A small bearish candle
- A larger bullish candle
The bullish candle completely engulfs the body of the previous bearish candle.
Simple Definition of Bullish Engulfing Pattern
A Bullish Engulfing Pattern indicates that buyers have overwhelmed sellers and may start a new uptrend.
Why Is It Called “Engulfing”?
The second bullish candle completely covers or engulfs the body of the first bearish candle.
This demonstrates a strong shift in market sentiment from bearish to bullish.
Structure of a Bullish Engulfing Pattern
The pattern contains two candles:
First Candle
A bearish candle.
Shows seller dominance.
Second Candle
A larger bullish candle.
Completely engulfs the body of the first candle.
Shows buyer dominance.
Characteristics of a Bullish Engulfing Pattern
| Feature | Description |
|---|---|
| Pattern Type | Bullish Reversal |
| Number of Candles | Two |
| Trend Requirement | Downtrend |
| Signal Strength | Strong |
| Reliability | High with Confirmation |
| Volume | Preferably Increasing |
Market Psychology Behind the Pattern
Understanding market psychology is the key to using the pattern effectively.
Stage 1: Sellers Control the Market
The first candle closes lower.
Market sentiment remains bearish.
Stage 2: Buyers Enter Aggressively
The second candle opens lower or near the previous close.
Strong buying pressure appears.
Stage 3: Buyers Overpower Sellers
Price rises sharply.
The bullish candle completely engulfs the previous candle.
Stage 4: Sentiment Changes
The market shifts from bearish to bullish.
Why Is the Bullish Engulfing Pattern Bullish?
The pattern indicates:
- Strong buying interest
- Weakening selling pressure
- Shift in market sentiment
- Potential trend reversal
This is why traders consider it a powerful bullish signal.
Conditions for a Valid Bullish Engulfing Pattern
Existing Downtrend
The pattern works best after a decline.
Complete Engulfing
The second candle’s body should fully engulf the first candle’s body.
Strong Bullish Candle
The larger the bullish candle, the stronger the signal.
Increasing Volume
Higher volume improves reliability.
How to Identify the Pattern
Step 1
Identify a downtrend.
Step 2
Look for a bearish candle.
Step 3
Find a large bullish candle immediately afterward.
Step 4
Ensure the bullish candle engulfs the previous candle’s body.
Step 5
Confirm using volume and other indicators.
Importance of Volume
Volume plays a major role in validating the pattern.
High Volume
Indicates strong buyer participation.
Increasing Volume
Improves breakout reliability.
Low Volume
May reduce the strength of the signal.
Trading Strategy Using Bullish Engulfing Pattern
Step 1
Identify the completed pattern.
Step 2
Wait for confirmation.
Step 3
Enter a buy trade.
Step 4
Place stop-loss below the pattern low.
Step 5
Set profit targets using resistance levels.
Entry Strategy
Aggressive Entry
Enter immediately after the bullish candle closes.
Conservative Entry
Wait for the next candle to confirm upward momentum.
Stop-Loss Placement
Proper risk management is essential.
Common Stop-Loss Level
Below the low of the engulfing candle.
Alternative Method
Below a nearby support level.
Profit Target Methods
Previous Resistance Levels
Common target areas.
Risk-Reward Ratio
Aim for at least:
1:2
or better.
Trailing Stop-Loss
Protect profits as the trend develops.
Example of a Bullish Engulfing Pattern
Suppose a stock is falling:
Day 1
Bearish candle:
₹500 → ₹480
Day 2
Bullish candle:
₹475 → ₹520
The second candle completely engulfs the first candle.
This suggests strong buying momentum.
Bullish Engulfing vs Bearish Engulfing
| Feature | Bullish Engulfing | Bearish Engulfing |
|---|---|---|
| Signal | Bullish Reversal | Bearish Reversal |
| Trend Requirement | Downtrend | Uptrend |
| First Candle | Bearish | Bullish |
| Second Candle | Bullish | Bearish |
| Market Sentiment | Buyers Gain Control | Sellers Gain Control |
Bullish Engulfing vs Hammer Pattern
| Feature | Bullish Engulfing | Hammer |
|---|---|---|
| Candles | Two | One |
| Signal Strength | Strong | Moderate to Strong |
| Confirmation | Recommended | Essential |
| Reliability | High | High |
Best Indicators to Use with Bullish Engulfing
RSI (Relative Strength Index)
Look for:
RSI Below 30
May indicate oversold conditions.
MACD
Bullish crossover improves confirmation.
Moving Averages
Support trend analysis.
Volume Analysis
Validates buyer participation.
Advantages of Bullish Engulfing Pattern
Strong Reversal Signal
Indicates significant buying pressure.
Easy to Identify
Simple visual structure.
Works Across Markets
Stocks, forex, commodities, and cryptocurrencies.
Suitable for Beginners
One of the easiest reversal patterns to learn.
Limitations of Bullish Engulfing Pattern
False Signals
Not every pattern leads to a reversal.
Requires Confirmation
Additional analysis improves accuracy.
Less Effective in Sideways Markets
Works best after a clear downtrend.
Common Beginner Mistakes
Ignoring Trend Context
The pattern should appear after a decline.
Trading Without Confirmation
Confirmation improves reliability.
Ignoring Volume
Volume validates the pattern.
No Stop-Loss
Always protect capital.
Best Time Frames for Trading
Intraday Trading
5-minute and 15-minute charts.
Swing Trading
Daily charts.
Positional Trading
Weekly charts.
Practical Example
Suppose:
A stock falls from ₹1,000 to ₹800.
A Bullish Engulfing pattern forms near a major support level.
Possible Trade Setup:
Entry
After confirmation candle.
Stop-Loss
Below the pattern low.
Target
Next resistance level.
How Reliable Is the Bullish Engulfing Pattern?
The Bullish Engulfing pattern is considered one of the strongest bullish reversal patterns because:
- Buyers completely overpower sellers.
- Market sentiment shifts rapidly.
- It often appears near important market bottoms.
However, no pattern guarantees success.
Best Combination for Beginners
Use:
Bullish Engulfing Pattern
Support Levels
RSI
Volume Analysis
for stronger bullish setups.
The Bullish Engulfing Pattern is a powerful buying momentum signal that often appears at the end of a downtrend. It reflects a clear shift from seller dominance to buyer control and can provide excellent trading opportunities when confirmed by volume, support levels, and technical indicators.
When combined with proper risk management and confirmation signals, the Bullish Engulfing pattern can become a valuable part of any trader’s technical analysis toolkit.
Remember: confirmation and discipline are essential for successful trading.
Frequently Asked Questions (FAQs)
1. What is a Bullish Engulfing Pattern?
A Bullish Engulfing Pattern is a two-candle bullish reversal pattern where a large bullish candle completely engulfs a smaller bearish candle.
2. Why is the Bullish Engulfing pattern bullish?
It shows that buyers have overwhelmed sellers and gained market control.
3. Where does the pattern work best?
After a downtrend and near strong support levels.
4. Does volume matter?
Yes. Higher volume strengthens the reliability of the pattern.
5. What is the ideal stop-loss placement?
Below the low of the engulfing candle.
6. Should I wait for confirmation?
Yes. Confirmation improves trade accuracy.
7. Which indicators work best with Bullish Engulfing?
RSI, MACD, Moving Averages, Support & Resistance, and Volume Analysis.
8. Can the pattern fail?
Yes. No candlestick pattern is 100% accurate.
9. Is the Bullish Engulfing Pattern suitable for beginners?
Yes. It is one of the simplest and most reliable bullish reversal patterns.
10. Can it be used in all markets?
Yes. It works in stocks, forex, commodities, indices, and cryptocurrency markets.