
The Shooting Star Candlestick Pattern is one of the most powerful bearish reversal patterns in technical analysis. It usually appears after a strong uptrend and signals that buyers may be losing control while sellers are beginning to dominate.
Traders use the Shooting Star pattern to identify potential market tops, trend reversals, and selling opportunities. When combined with volume analysis, support and resistance levels, and technical indicators, it can become a highly effective trading tool
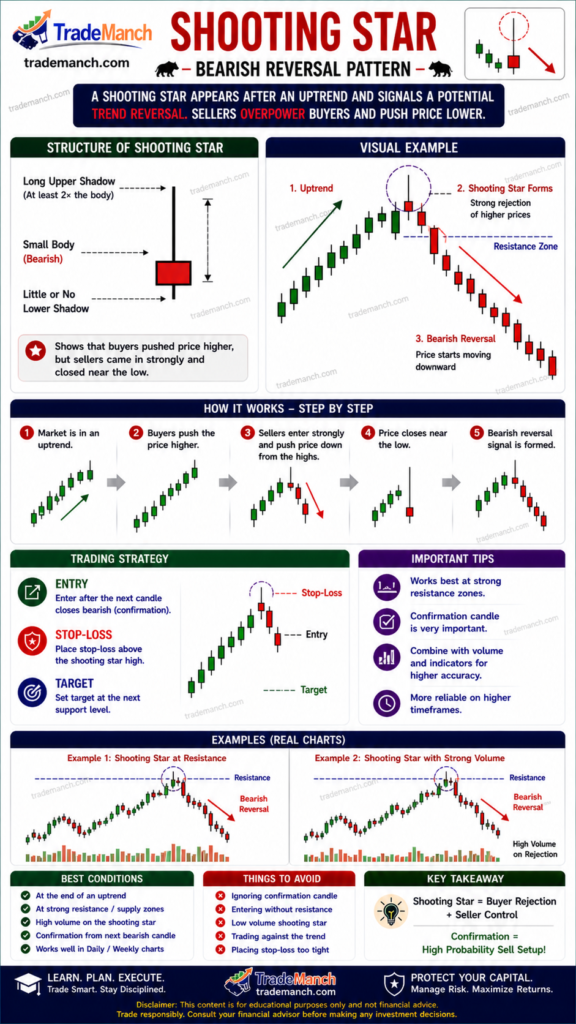
This guide explains the Shooting Star Candlestick Pattern in simple language with practical examples and trading strategies.
What Is a Shooting Star Candlestick Pattern?
A Shooting Star is a single-candle bearish reversal pattern that typically appears after an uptrend.
It has:
- A small real body
- A long upper shadow (wick)
- Little or no lower shadow
The candle resembles a shooting star falling from the sky, which is how the pattern got its name.
Simple Definition of Shooting Star Pattern
A Shooting Star indicates that buyers pushed prices higher, but sellers regained control and forced prices back down before the candle closed.
Structure of a Shooting Star Candlestick
A valid Shooting Star usually has:
Small Real Body
Located near the bottom of the candle.
Long Upper Shadow
At least two times the size of the body.
Small or No Lower Shadow
Shows seller dominance near the close.
Shooting Star Pattern Characteristics
| Feature | Description |
|---|---|
| Trend Requirement | Uptrend |
| Signal Type | Bearish Reversal |
| Number of Candles | One |
| Reliability | High (with confirmation) |
| Best Location | Near Resistance Levels |
Market Psychology Behind the Shooting Star
Understanding the psychology behind the pattern is essential.
Step 1: Buyers Dominate
At the beginning of the session, buyers continue pushing prices higher.
Step 2: New High Is Created
The stock reaches a significantly higher price.
Step 3: Sellers Enter
Strong selling pressure appears at higher levels.
Step 4: Price Falls Back
Sellers push prices back near the opening level.
Step 5: Bearish Warning Signal
The long upper wick shows rejection of higher prices.
Why Is the Shooting Star Bearish?
The pattern shows that:
- Buyers attempted to continue the uptrend.
- Sellers strongly rejected higher prices.
- Buying momentum weakened.
This often signals a potential downward reversal.
Where Does the Shooting Star Work Best?
After a Strong Uptrend
The pattern becomes more meaningful after a sustained rally.
Near Resistance Levels
Resistance zones strengthen the bearish signal.
Near Previous Highs
Historic resistance increases reliability.
Near Moving Averages
Important moving averages may act as resistance.
Examples:
- 50 EMA
- 200 EMA
Shooting Star vs Normal Candlestick
| Feature | Normal Candle | Shooting Star |
|---|---|---|
| Upper Shadow | Small | Long |
| Reversal Signal | Weak | Strong |
| Seller Strength | Moderate | High |
| Reliability | Lower | Higher |
Example of a Shooting Star Pattern
Suppose a stock is trading at:
₹1,000
During the session:
- Opens at ₹1,000
- Rises to ₹1,100
- Falls and closes at ₹1,010
Result:
A Shooting Star pattern forms.
This suggests sellers strongly rejected higher prices.
Confirmation of Shooting Star Pattern
A Shooting Star alone should not be traded immediately.
Confirmation is important.
Bearish Confirmation Candle
The next candle should:
- Close below the Shooting Star low
- Show strong selling pressure
Increased Volume
Higher volume improves reliability.
Trading Strategy Using Shooting Star
Step 1
Identify an uptrend.
Step 2
Locate a Shooting Star candle.
Step 3
Wait for confirmation.
Step 4
Enter after a bearish confirmation candle.
Step 5
Place stop-loss above the Shooting Star high.
Stop-Loss Placement
The Shooting Star’s high often serves as a logical stop-loss level.
Example
Shooting Star High:
₹1,100
Stop-Loss:
Slightly above ₹1,100
Profit Target Methods
Support Levels
Target nearby support zones.
Risk-Reward Ratio
Maintain at least:
1:2
or better.
Trailing Stop-Loss
Lock in profits as the trade moves in your favor.
Shooting Star Pattern with Volume
Volume significantly affects pattern reliability.
High Volume Shooting Star
Strong bearish signal.
Low Volume Shooting Star
Less reliable.
Shooting Star Pattern with RSI
Combining RSI improves accuracy.
Shooting Star + RSI Above 70
May indicate:
Overbought Conditions
Potential bearish reversal.
Shooting Star Pattern with MACD
MACD can confirm weakening momentum.
Shooting Star + MACD Bearish Crossover
Higher probability setup.
Shooting Star Pattern with Resistance
The best Shooting Star patterns often appear:
Near Major Resistance
Higher success rate.
Near Supply Zones
Increased selling activity.
Difference Between Shooting Star and Inverted Hammer
| Feature | Shooting Star | Inverted Hammer |
|---|---|---|
| Trend | Uptrend | Downtrend |
| Signal | Bearish | Bullish |
| Location | Market Top | Market Bottom |
| Interpretation | Seller Strength | Buyer Strength |
Advantages of Shooting Star Pattern
Easy to Identify
Suitable for beginners.
Strong Reversal Signal
Widely respected by traders.
Works Across Markets
Stocks, forex, commodities, and crypto.
Clear Risk Management
Easy stop-loss placement.
Limitations of Shooting Star Pattern
Not Always Accurate
False signals occur.
Requires Confirmation
Never trade based solely on the candle.
Less Effective in Sideways Markets
Works best after strong trends.
Common Beginner Mistakes
Trading Without Confirmation
Always wait for the next candle.
Ignoring Volume
Volume confirms pattern strength.
Using It in a Downtrend
Context matters.
No Stop-Loss
Risk management is essential.
Best Time Frames for Trading
Intraday Trading
5-minute and 15-minute charts.
Swing Trading
Daily charts.
Positional Trading
Weekly charts.
Practical Example
Suppose:
A stock rises from ₹800 to ₹1,200.
A Shooting Star forms near ₹1,200 resistance.
Next day:
Price closes below the Shooting Star low.
Possible Trade:
Entry
Below the Shooting Star low.
Stop-Loss
Above the Shooting Star high.
Target
Next major support level.
Can the Shooting Star Pattern Fail?
Yes.
Reasons include:
- Weak volume
- Strong bullish trend
- Positive news events
- Lack of confirmation
This is why proper risk management is crucial.
Best Combination for Beginners
Use:
Shooting Star Pattern
Resistance Levels
RSI
Volume Analysis
for higher-quality trade setups.
The Shooting Star Candlestick Pattern is one of the strongest bearish reversal signals in technical analysis. It reflects a failed attempt by buyers to continue the uptrend and shows that sellers are becoming more aggressive.
When combined with resistance levels, volume confirmation, RSI, MACD, and proper risk management, the Shooting Star can help traders identify high-probability reversal opportunities.
Remember: a Shooting Star suggests a potential reversal—not a guaranteed one. Always wait for confirmation before entering a trade.
Frequently Asked Questions (FAQs)
1. What is a Shooting Star Candlestick Pattern?
A Shooting Star is a bearish reversal candlestick pattern with a small body and a long upper shadow.
2. Why is the Shooting Star pattern bearish?
It shows that sellers rejected higher prices and regained control before the candle closed.
3. Where does a Shooting Star work best?
After an uptrend and near major resistance levels.
4. Is a Shooting Star enough to enter a trade?
No. Confirmation from the next bearish candle is recommended.
5. What is the ideal stop-loss for a Shooting Star trade?
Above the high of the Shooting Star candle.
6. Does volume matter for Shooting Star patterns?
Yes. Higher volume generally increases reliability.
7. What is the difference between a Shooting Star and an Inverted Hammer?
A Shooting Star appears after an uptrend and is bearish, while an Inverted Hammer appears after a downtrend and is bullish.
8. Can a Shooting Star pattern fail?
Yes. No candlestick pattern is 100% accurate.
9. Which indicators work best with a Shooting Star?
RSI, MACD, Moving Averages, Support & Resistance, and Volume Analysis.
10. Is the Shooting Star suitable for beginners?
Yes. It is one of the easiest and most effective bearish reversal candlestick patterns to learn.