The Rounding Bottom (also known as a Saucer Bottom) is a long-term bullish reversal chart pattern that signals a gradual shift from a downtrend to an uptrend. It reflects a slow but steady change in market sentiment from bearish to bullish.
🔍 What is a Rounding Bottom?
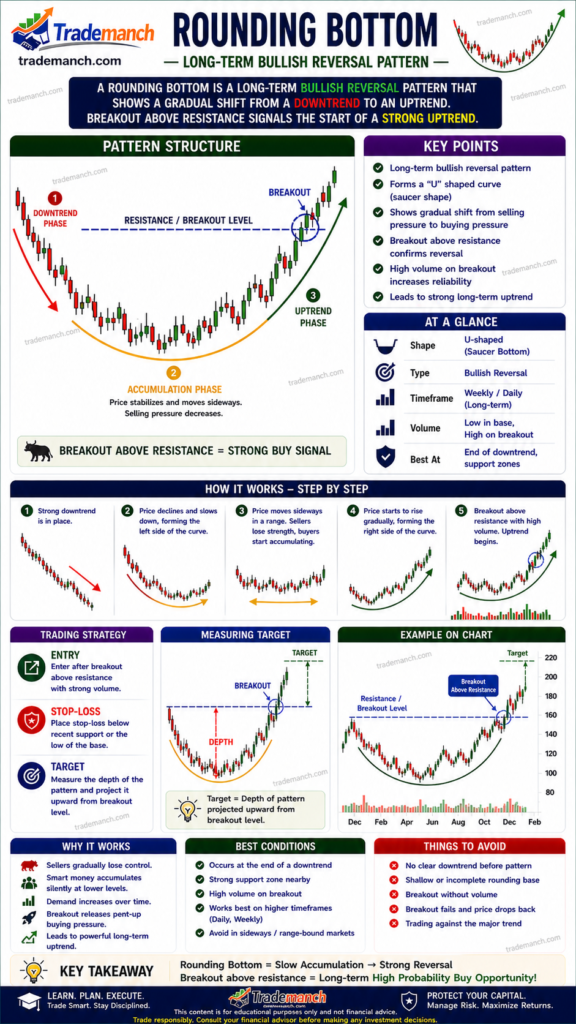
A Rounding Bottom forms when the price creates a smooth, curved structure that looks like a “U” shape over a longer time period. Unlike sharp reversals, this pattern indicates a gradual accumulation phase before a breakout.
📈 Structure of Rounding Bottom
- Downtrend Phase: Price declines steadily
- Bottom Formation: Price stabilizes and moves sideways (accumulation zone)
- Recovery Phase: Price gradually starts rising
- Breakout: Price breaks above resistance, confirming reversal
🧠 Market Psychology
- Sellers dominate initially and push prices lower ❌
- Selling pressure starts weakening
- Buyers slowly enter the market (accumulation) ✅
- Momentum builds → leads to a long-term bullish trend
This pattern shows a shift from fear to confidence among market participants.
🚀 How to Trade Rounding Bottom
✅ Entry Point
- Enter after breakout above resistance with volume confirmation
🛑 Stop Loss
- Place stop loss below the recent swing low
🎯 Target Price
- Measure the depth of the pattern (Top – Bottom)
- Add it to the breakout level
📊 Key Characteristics
- Smooth U-shaped curve
- Forms over a long time period (weeks to months)
- Low volume during bottom formation
- High volume during breakout
- No sharp or sudden price movements
⚠️ Important Tips
- Ideal for long-term investors
- Avoid patterns with sharp V-shaped reversals
- Confirm breakout with volume and indicators (RSI, MACD)
- Patience is key—pattern takes time to develop
- Works best on daily and weekly charts