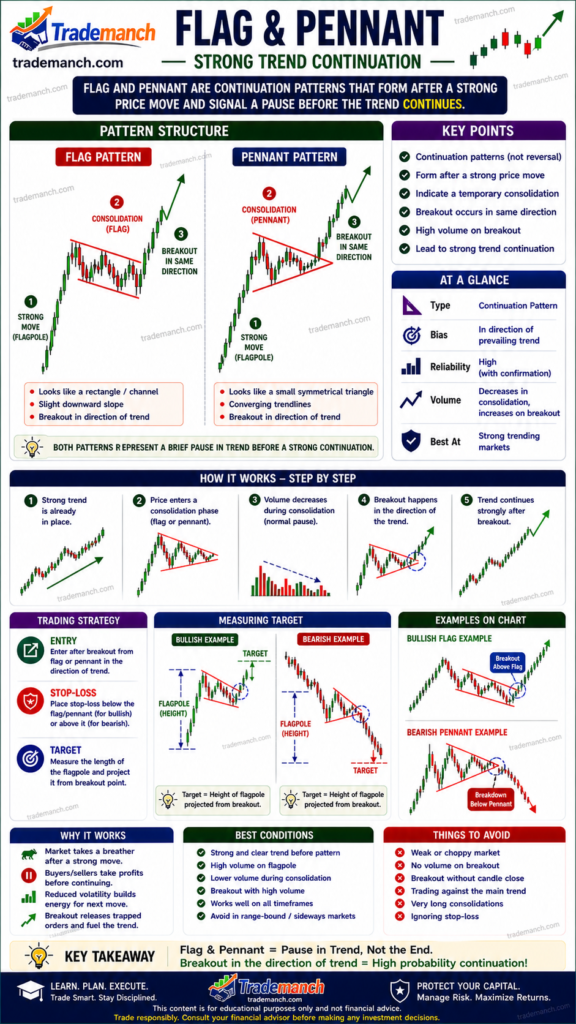
Flag and Pennant are powerful continuation chart patterns that appear after a sharp price move (called the flagpole). They signal a brief pause in the trend before the price continues in the same direction—either bullish or bearish.
🔍 What are Flag & Pennant Patterns?
Both patterns form after a strong momentum move:
- Flag: A small rectangular channel sloping against the trend
- Pennant: A small symmetrical triangle formed by converging trendlines
They represent short consolidation before the next breakout.
📈 Structure of Flag & Pennant
1. Flag Pattern
- Flagpole: Strong upward or downward move
- Consolidation: Parallel channel (slightly sloping)
- Breakout: Continuation in the same direction
2. Pennant Pattern
- Flagpole: Sharp price movement
- Consolidation: Small triangle (converging lines)
- Breakout: Strong move in the direction of the previous trend
🧠 Market Psychology
- After a strong move, traders take short-term profits
- Price consolidates in a tight range
- New buyers/sellers enter the market
- Momentum resumes → trend continues strongly
🚀 How to Trade Flag & Pennant
✅ Entry Point
- Enter after breakout from the flag or pennant
- Confirm with volume spike
🛑 Stop Loss
- Place stop loss below the pattern (bullish)
- Place stop loss above the pattern (bearish)
🎯 Target Price
- Measure the length of the flagpole
- Project it from the breakout point
📊 Key Characteristics
- Sharp flagpole move before pattern
- Short consolidation period
- Low volume during formation
- High volume on breakout
- Works in both uptrend and downtrend
⚠️ Important Tips
- Stronger when formed after high momentum moves
- Avoid weak or sideways markets
- Confirm breakout with volume and indicators (RSI, MACD)
- Best used in intraday and trending markets