The Descending Triangle is a widely used bearish continuation chart pattern that indicates the price is likely to continue moving downward after consolidation. It’s especially effective in identifying breakdown opportunities during a downtrend.
🔍 What is a Descending Triangle?
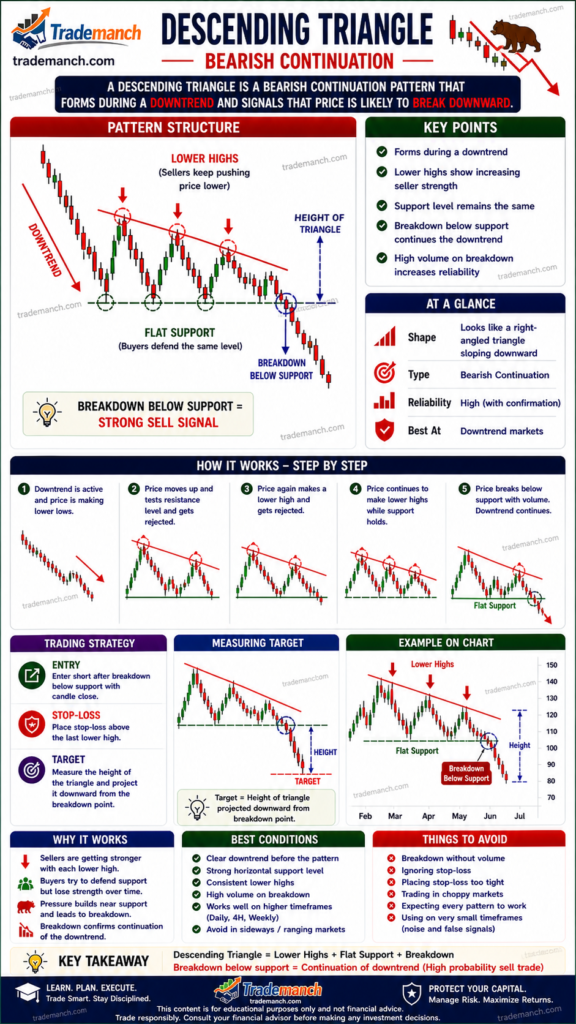
A Descending Triangle forms when the price creates:
- A horizontal support level (flat bottom)
- A descending trendline (lower highs)
This structure shows increasing selling pressure as sellers push the price lower with each attempt.
📈 Structure of Descending Triangle
The pattern includes three main components:
- Support Line (Flat Bottom): Price repeatedly tests a strong support level
- Lower Highs: Sellers step in earlier each time, forming a downward trendline
- Breakdown: Price breaks below support, confirming bearish continuation
🧠 Market Psychology
- Buyers try to hold support multiple times ✅
- Sellers become more aggressive with each rally ❌
- Pressure builds → results in a bearish breakdown
This reflects weakening demand and increasing supply in the market.
🚀 How to Trade Descending Triangle
✅ Entry Point
- Enter a trade after breakdown below support with strong volume
🛑 Stop Loss
- Place stop loss above the descending trendline
🎯 Target Price
- Measure the height of the triangle (Highest High – Support)
- Subtract it from the breakdown point
📊 Key Characteristics
- Flat support level
- Falling resistance trendline
- At least 2–3 touches on both levels
- Volume increases during breakdown
- Commonly appears in a downtrend
⚠️ Important Tips
- Always wait for a confirmed breakdown
- Avoid trading false breakouts in low-volume markets
- Use indicators like RSI, MACD, Moving Averages for confirmation
- Works effectively on intraday and higher timeframes