
The Head and Shoulders Pattern is one of the most reliable and widely recognized chart patterns in technical analysis. It is considered a powerful bearish reversal signal that often appears after a strong uptrend and indicates that buyers may be losing control while sellers are starting to dominate.
Professional traders use the Head and Shoulders pattern to identify potential trend reversals, plan entries and exits, and manage risk effectively
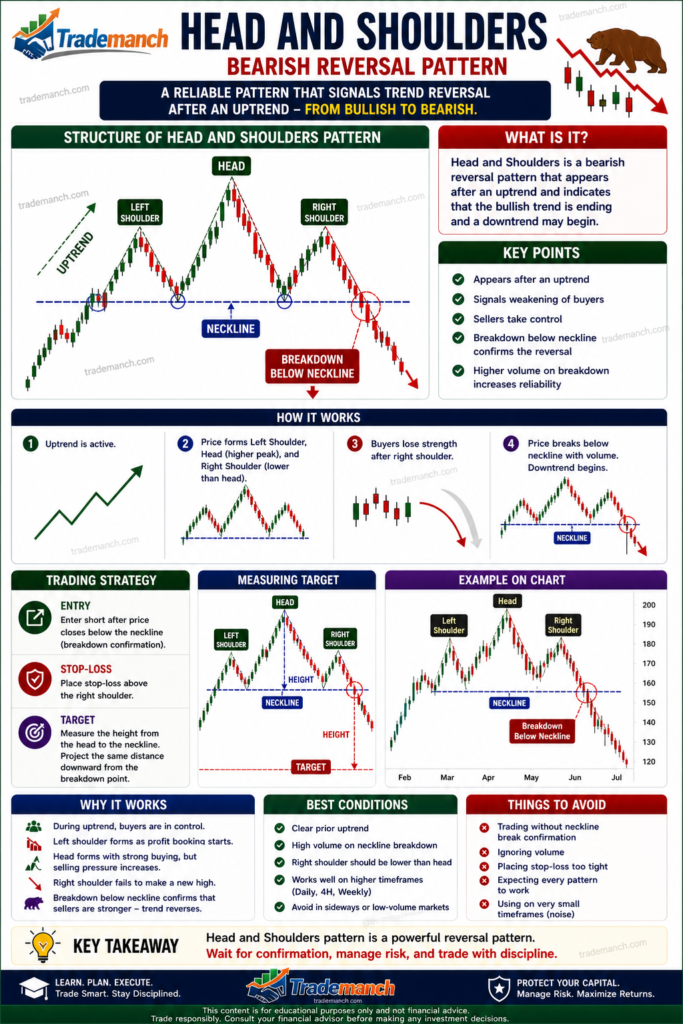
In this guide, you’ll learn everything about the Head and Shoulders pattern, including its structure, psychology, confirmation, trading strategy, and common mistakes.
What Is a Head and Shoulders Pattern?
The Head and Shoulders pattern is a bearish reversal chart pattern that forms after an uptrend.
It consists of three peaks:
- Left Shoulder
- Head
- Right Shoulder
The middle peak (Head) is higher than the other two peaks.
Simple Definition of Head and Shoulders Pattern
A Head and Shoulders pattern signals that an uptrend may be ending and a downtrend could begin.
Why Is It Called Head and Shoulders?
The pattern visually resembles a human head with two shoulders.
Structure:
Left Shoulder
First peak.
Head
Highest peak.
Right Shoulder
Third peak, usually similar in height to the left shoulder.
Components of a Head and Shoulders Pattern
Left Shoulder
Price rises and creates a peak.
After reaching the peak, price pulls back.
Head
Price rises again and makes a higher high.
This creates the head.
Another pullback follows.
Right Shoulder
Price rises once more but fails to make a new high.
This forms the right shoulder.
Neckline
A trendline connecting the two swing lows between the shoulders and head.
The neckline is the most important part of the pattern.
Structure of Head and Shoulders
A typical pattern consists of:
Peak 1
Left Shoulder
Peak 2
Head (highest point)
Peak 3
Right Shoulder
Support Line
Neckline
Market Psychology Behind the Pattern
Understanding the psychology helps traders trust the pattern.
Stage 1: Strong Uptrend
Buyers are fully in control.
Market continues making higher highs.
Stage 2: Left Shoulder Forms
First sign of profit booking appears.
Price pulls back after reaching a new high.
Stage 3: Head Forms
Buyers push prices to a fresh high.
However, momentum begins weakening.
Stage 4: Right Shoulder Forms
Buyers attempt another rally.
This time, they fail to create a new high.
A sign of weakness emerges.
Stage 5: Neckline Breaks
Sellers gain control.
The bullish trend begins reversing.
Why the Head and Shoulders Pattern Is Bearish
The pattern shows:
- Weakening buyer momentum
- Increasing seller pressure
- Failure to make higher highs
These factors often signal a trend reversal.
Importance of the Neckline
The neckline acts as a critical support level.
Pattern Is Not Confirmed Until
Price breaks below the neckline.
Neckline Breakdown
Signals that sellers have taken control.
Types of Necklines
Horizontal Neckline
Most common.
Provides a clear breakdown level.
Ascending Neckline
Slightly upward sloping.
Still valid.
Descending Neckline
Slopes downward.
Can produce faster breakdowns.
How to Confirm a Head and Shoulders Pattern
Confirmation is essential.
Price Breaks Below Neckline
Primary confirmation signal.
High Volume Breakdown
Increases reliability.
Follow-Through Selling
Additional bearish confirmation.
Volume Analysis
Volume often tells the real story.
Left Shoulder
High volume.
Head
Moderate volume.
Right Shoulder
Lower volume.
Neckline Breakdown
High volume.
Strong confirmation.
Trading Strategy Using Head and Shoulders
Step 1
Identify an existing uptrend.
Step 2
Locate the three peaks.
Step 3
Draw the neckline.
Step 4
Wait for neckline breakdown.
Step 5
Enter a short trade after confirmation.
Entry Strategy
Aggressive Entry
Immediately after neckline breakdown.
Conservative Entry
Wait for a retest of the neckline.
Stop-Loss Placement
A logical stop-loss can be placed:
Above Right Shoulder
Most common approach.
Above Neckline Retest
For tighter risk management.
Profit Target Calculation
Target is calculated using:
Pattern Height
Distance between Head and Neckline.
Formula:
Target=Neckline−(Head−Neckline)
Example
Suppose:
Head = ₹1,000
Neckline = ₹900
Pattern Height:
1000−900=100
Target:
900−100=800
Potential Target = ₹800
Inverse Head and Shoulders Pattern
The bullish version of the pattern.
What Is an Inverse Head and Shoulders?
Appears after a downtrend.
Signals a potential bullish reversal.
Structure
Left Shoulder
First bottom.
Head
Lowest bottom.
Right Shoulder
Higher bottom.
Neckline
Resistance line connecting swing highs.
Confirmation
Price breaks above the neckline.
Head and Shoulders vs Double Top
| Feature | Head and Shoulders | Double Top |
|---|---|---|
| Peaks | Three | Two |
| Reliability | Very High | High |
| Signal | Bearish Reversal | Bearish Reversal |
| Complexity | Moderate | Simple |
Best Indicators to Use with Head and Shoulders
RSI
Confirms weakening momentum.
MACD
Identifies bearish crossovers.
Volume
Confirms breakdown strength.
Moving Averages
Supports trend analysis.
Advantages of Head and Shoulders Pattern
Highly Reliable
One of the strongest reversal patterns.
Clear Entry and Exit Levels
Easy trade planning.
Works Across Markets
Stocks, forex, commodities, and crypto.
Excellent Risk Management
Logical stop-loss placement.
Limitations of Head and Shoulders Pattern
False Breakdowns
Can occur without confirmation.
Requires Patience
Pattern formation may take time.
Volume Confirmation Needed
Volume improves reliability.
Common Beginner Mistakes
Trading Before Neckline Break
Wait for confirmation.
Ignoring Volume
Volume validates the pattern.
Forcing the Pattern
Only trade clear formations.
No Stop-Loss
Always manage risk.
Best Time Frames for Trading
Intraday Trading
5-minute and 15-minute charts.
Swing Trading
Daily charts.
Positional Trading
Weekly charts.
Practical Example
Suppose a stock:
- Rises from ₹500 to ₹1,000
- Forms a Head and Shoulders pattern
- Breaks neckline at ₹900
Possible Setup:
Entry
Below ₹900
Stop-Loss
Above right shoulder
Target
Based on pattern height
How Reliable Is the Head and Shoulders Pattern?
Among technical patterns, it is considered one of the most reliable.
However:
- No pattern guarantees success.
- Confirmation remains essential.
- Risk management is critical.
Best Combination for Beginners
Use:
Head and Shoulders Pattern
Volume Analysis
RSI
Support & Resistance
for stronger trade setups.
The Head and Shoulders Pattern is one of the most powerful bearish reversal signals in technical analysis. It reflects weakening buyer strength and increasing seller control, often marking the transition from an uptrend to a downtrend.
By understanding the pattern structure, neckline, volume confirmation, and proper risk management, traders can use this pattern to identify high-probability trading opportunities. While highly reliable, it should always be combined with confirmation signals and disciplined risk management.
Remember: the Head and Shoulders pattern signals a potential reversal—not a guaranteed one.
Frequently Asked Questions (FAQs)
1. What is a Head and Shoulders Pattern?
A Head and Shoulders Pattern is a bearish reversal chart pattern that typically forms after an uptrend.
2. Why is the Head and Shoulders pattern bearish?
It shows weakening buyer momentum and increasing seller pressure.
3. What is the neckline?
The neckline is a support line connecting the swing lows within the pattern.
4. When is the pattern confirmed?
The pattern is confirmed when price breaks below the neckline.
5. What is an Inverse Head and Shoulders pattern?
It is the bullish version of the pattern and signals a potential upward reversal.
6. How is the profit target calculated?
Using the height between the Head and the Neckline.
7. Why is volume important?
High volume during the neckline breakdown increases reliability.
8. Which indicators work best with Head and Shoulders?
RSI, MACD, Moving Averages, and Volume Analysis.
9. Can the pattern fail?
Yes. False breakdowns can occur.
10. Is the Head and Shoulders pattern suitable for beginners?
Yes. It is one of the most widely taught and reliable chart patterns in technical analysis.