
Chart patterns are one of the most important tools in Technical Analysis. They help traders identify potential trend reversals, continuation patterns, and future price movements based on historical market behavior.
Among the hundreds of chart patterns available, Head & Shoulders, Double Top, and Double Bottom are some of the most reliable and widely used patterns by professional traders. Understanding these patterns can help traders improve entry timing, exit timing, and risk management.
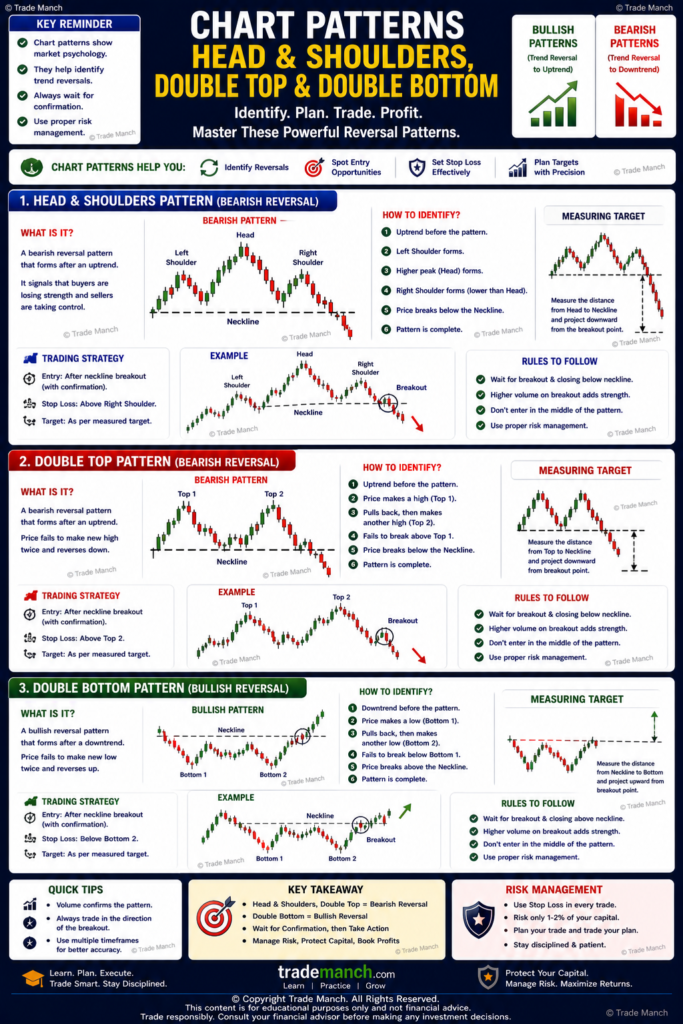
This guide explains these chart patterns in simple language with practical examples.
What Are Chart Patterns?
Chart patterns are recognizable formations created by price movements on a stock chart.
They help traders:
- Identify trend reversals
- Spot continuation opportunities
- Understand market psychology
- Plan trades more effectively
Simple Definition of Chart Patterns
Chart patterns are price formations that indicate potential future market direction.
Why Chart Patterns Matter
Chart patterns help traders:
Understand Market Sentiment
Analyze buyer and seller behavior.
Identify Trend Reversals
Spot potential changes in direction.
Improve Entry Timing
Find better trading opportunities.
Support Risk Management
Assist in stop-loss and target placement.
Head & Shoulders Pattern
What Is a Head & Shoulders Pattern?
The Head & Shoulders pattern is one of the most reliable bearish reversal patterns in technical analysis.
It usually appears after a strong uptrend and signals a potential trend reversal from bullish to bearish.
Simple Definition
A Head & Shoulders pattern indicates that buying momentum is weakening and sellers may take control.
Structure of Head & Shoulders
The pattern consists of three peaks:
Left Shoulder
First peak.
Head
Highest peak.
Right Shoulder
Third peak, usually similar in height to the left shoulder.
Neckline
A support line connecting the lows between the peaks.
Market Psychology Behind Head & Shoulders
Left Shoulder
Buyers push prices higher.
Head
Buyers create a new high.
Right Shoulder
Buyers fail to make another higher high.
Neckline Breakdown
Sellers gain control.
Confirmation of Head & Shoulders
The pattern is confirmed when price breaks below the neckline with strong volume.
Trading Strategy
Entry
After neckline breakdown.
Stop-Loss
Above the right shoulder.
Target
The distance from the head to the neckline projected downward.
Advantages of Head & Shoulders
Highly Reliable
Widely respected reversal pattern.
Clear Risk Management
Provides logical stop-loss placement.
Limitations
False Breakouts
Confirmation is necessary.
Inverse Head & Shoulders
What Is an Inverse Head & Shoulders?
An Inverse Head & Shoulders is the bullish version of the pattern.
It appears after a downtrend.
Simple Definition
An Inverse Head & Shoulders signals a potential reversal from bearish to bullish.
Structure
Left Shoulder
Initial decline.
Head
Lowest point.
Right Shoulder
Higher low forms.
Neckline
Resistance line connecting swing highs.
Confirmation
The pattern is confirmed when price breaks above the neckline.
Market Psychology
Sellers Lose Strength
Downward momentum weakens.
Buyers Gain Control
Bullish reversal becomes possible.
Double Top Pattern
What Is a Double Top?
A Double Top is a bearish reversal pattern that forms after an uptrend.
It resembles the letter “M”.
Simple Definition
A Double Top indicates that buyers failed to push prices above a resistance level twice.
Structure of Double Top
First Peak
Price reaches resistance.
Pullback
Price declines.
Second Peak
Price revisits resistance but fails to break higher.
Neckline
Support level between the two peaks.
Market Psychology
First Peak
Strong buying pressure.
Second Peak
Buyers attempt another breakout.
Failure
Sellers become stronger.
Confirmation
The pattern is confirmed when price breaks below the neckline.
Trading Strategy
Entry
After neckline breakdown.
Stop-Loss
Above the second peak.
Target
Pattern height projected downward.
Advantages of Double Top
Easy to Identify
Simple structure.
Strong Reversal Signal
Common in trending markets.
Limitations
Requires Confirmation
Premature entries can be risky.
Double Bottom Pattern
What Is a Double Bottom?
A Double Bottom is a bullish reversal pattern that forms after a downtrend.
It resembles the letter “W”.
Simple Definition
A Double Bottom indicates that sellers failed to push prices lower twice.
Structure of Double Bottom
First Bottom
Price reaches support.
Bounce
Price moves higher.
Second Bottom
Price revisits support but fails to break lower.
Neckline
Resistance level between the two bottoms.
Market Psychology
First Bottom
Strong selling pressure.
Second Bottom
Sellers attempt another breakdown.
Failure
Buyers begin gaining control.
Confirmation
The pattern is confirmed when price breaks above the neckline.
Trading Strategy
Entry
After neckline breakout.
Stop-Loss
Below the second bottom.
Target
Pattern height projected upward.
Advantages of Double Bottom
Strong Bullish Signal
Indicates trend reversal.
Easy to Recognize
Suitable for beginners.
Limitations
False Breakouts
Need volume confirmation.
Head & Shoulders vs Double Top
| Feature | Head & Shoulders | Double Top |
|---|---|---|
| Pattern Shape | Three Peaks | Two Peaks |
| Signal | Bearish Reversal | Bearish Reversal |
| Reliability | Very High | High |
| Complexity | Moderate | Simple |
Double Bottom vs Inverse Head & Shoulders
| Feature | Double Bottom | Inverse Head & Shoulders |
|---|---|---|
| Pattern Shape | W Shape | Three Bottoms |
| Signal | Bullish Reversal | Bullish Reversal |
| Complexity | Simple | Moderate |
| Reliability | High | Very High |
Importance of Volume
Volume plays a crucial role in confirming chart patterns.
High Volume Breakout
More reliable signal.
Low Volume Breakout
Higher probability of failure.
Best Indicators to Combine with Chart Patterns
RSI
Measures momentum.
MACD
Confirms trend changes.
Moving Averages
Identify overall trend direction.
Volume Analysis
Confirms breakout strength.
Common Beginner Mistakes
Trading Before Confirmation
Always wait for neckline breakout or breakdown.
Ignoring Volume
Volume confirms pattern validity.
Poor Stop-Loss Placement
Risk management is essential.
Forcing Patterns
Only trade clearly formed patterns.
Practical Trading Example
Suppose a stock:
- Rises from ₹500 to ₹700
- Forms a Double Top near ₹700
- Breaks support at ₹650
Possible trade:
Entry
Below ₹650.
Stop-Loss
Above ₹700.
Target
Based on pattern height.
Advantages of Chart Patterns
Visual and Easy to Learn
Suitable for beginners.
Work Across Markets
Stocks, forex, commodities, and crypto.
Improve Trade Planning
Provide entry, exit, and target levels.
Limitations of Chart Patterns
Not 100% Accurate
False signals can occur.
Subjective Interpretation
Different traders may see different patterns.
Require Confirmation
Never trade based solely on pattern appearance.
Best Way for Beginners to Learn
Step 1
Understand market trends.
Step 2
Study major chart patterns.
Step 3
Practice on historical charts.
Step 4
Combine patterns with volume and indicators.
Step 5
Use proper risk management.
Head & Shoulders, Double Top, and Double Bottom are among the most reliable chart patterns in technical analysis. Head & Shoulders and Double Top patterns typically indicate bearish reversals, while Double Bottom and Inverse Head & Shoulders patterns signal bullish reversals.
These patterns provide valuable insights into market psychology and trend changes. However, traders should always wait for confirmation, analyze volume, and use proper risk management before taking trades.
Remember: chart patterns increase probabilities, but they do not guarantee market outcomes.
Frequently Asked Questions (FAQs)
1. What is a Head & Shoulders pattern?
A Head & Shoulders pattern is a bearish reversal pattern that forms after an uptrend and signals potential downward movement.
2. What is an Inverse Head & Shoulders pattern?
An Inverse Head & Shoulders is a bullish reversal pattern that forms after a downtrend.
3. What is a Double Top pattern?
A Double Top is a bearish reversal pattern where price fails to break resistance twice.
4. What is a Double Bottom pattern?
A Double Bottom is a bullish reversal pattern where price fails to break support twice.
5. Why is the neckline important?
The neckline acts as the confirmation level for breakouts and breakdowns.
6. Should I trade before confirmation?
No. Always wait for the neckline breakout or breakdown.
7. Why is volume important?
Volume helps confirm the strength and reliability of chart patterns.
8. Which pattern is more reliable: Head & Shoulders or Double Top?
Head & Shoulders is generally considered slightly more reliable.
9. Can chart patterns work in all markets?
Yes. They can be used in stocks, forex, commodities, indices, and cryptocurrency markets.
10. Do chart patterns guarantee profits?
No. They provide probabilities and potential setups, not guaranteed outcomes.