
Candlestick patterns are one of the most important tools used in technical analysis and price action trading. Traders use candlestick patterns to understand:
Continuation patterns
Market psychology
Buyer and seller strength
Trend reversals
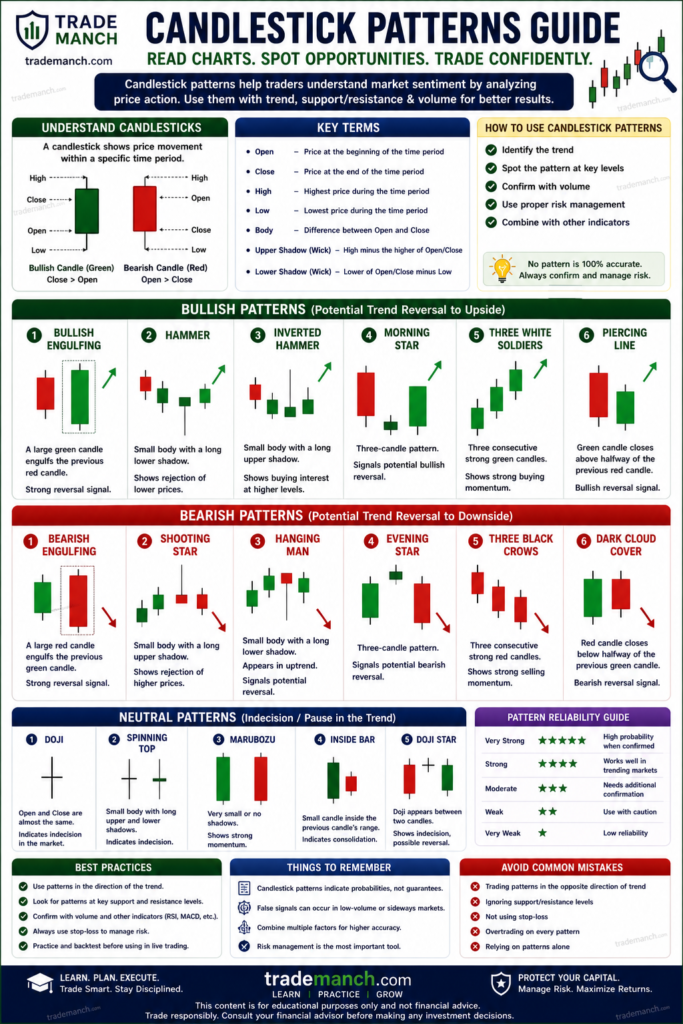
Candlestick analysis is widely used in:
- Intraday trading
- Swing trading
- Forex trading
- Crypto trading
- Stock market investing
In this complete beginner-friendly guide, you will learn what candlestick patterns are, how they work, major bullish and bearish patterns, and how traders use them in real trading.
What Is a Candlestick?
A candlestick is a graphical representation of price movement during a specific time period.
Each candlestick shows:
- Open price
- High price
- Low price
- Close price
This is called:
- OHLC data
Structure of a Candlestick
A candlestick has:
- Body
- Upper wick
- Lower wick
Bullish Candlestick
A bullish candle forms when:
- Closing price is higher than opening price.
This indicates:
- Buyer strength
Bearish Candlestick
A bearish candle forms when:
- Closing price is lower than opening price.
This indicates:
- Seller strength
Importance of Candlestick Patterns
Candlestick patterns help traders:
- Identify reversals
- Spot trends
- Find entry and exit points
- Understand market sentiment
Candlestick patterns reflect:
- Trading psychology
- Fear and greed
- Market momentum
Types of Candlestick Patterns
Candlestick patterns are mainly divided into:
- Bullish patterns
- Bearish patterns
- Continuation patterns
- Reversal patterns
Single Candlestick Patterns
1. Doji Candle
A Doji forms when:
- Open price and close price are nearly equal.
It indicates:
- Market indecision
Types of Doji
- Neutral Doji
- Dragonfly Doji
- Gravestone Doji
Meaning of Doji
Doji suggests:
- Buyers and sellers are balanced.
It may signal:
- Trend reversal
- Consolidation
2. Hammer Pattern
The Hammer is a bullish reversal pattern.
Characteristics:
- Small body
- Long lower wick
- Appears after downtrend
It indicates:
- Buyers are gaining strength.
Hammer Example
If price falls sharply but recovers strongly before closing:
- Hammer pattern forms.
3. Hanging Man Pattern
Looks similar to Hammer but appears after an uptrend.
It signals:
- Possible bearish reversal.
4. Shooting Star Pattern
A bearish reversal pattern appearing after an uptrend.
Characteristics:
- Small body
- Long upper wick
It indicates:
- Seller pressure increasing.
5. Inverted Hammer
Appears after downtrend.
Signals:
- Possible bullish reversal.
Double Candlestick Patterns
1. Bullish Engulfing Pattern
A large bullish candle completely covers the previous bearish candle.
It signals:
- Strong buying pressure
- Possible upward reversal
Example
Day 1:
- Small bearish candle
Day 2:
- Large bullish candle engulfs previous candle
This indicates bullish momentum.
2. Bearish Engulfing Pattern
A large bearish candle completely covers previous bullish candle.
It signals:
- Strong selling pressure
- Possible downward reversal
3. Tweezer Bottom Pattern
Two candles form similar lows.
Signals:
- Bullish reversal
4. Tweezer Top Pattern
Two candles form similar highs.
Signals:
- Bearish reversal
Triple Candlestick Patterns
1. Morning Star Pattern
A bullish reversal pattern.
Structure:
- Large bearish candle
- Small indecision candle
- Strong bullish candle
It signals:
- Trend reversal from bearish to bullish.
2. Evening Star Pattern
Bearish reversal pattern.
Structure:
- Strong bullish candle
- Small indecision candle
- Strong bearish candle
It signals:
- Potential downtrend.
3. Three White Soldiers
Three strong bullish candles appear consecutively.
Signals:
- Strong bullish momentum
4. Three Black Crows
Three strong bearish candles appear consecutively.
Signals:
- Strong bearish momentum
Continuation Candlestick Patterns
Continuation patterns suggest:
- Existing trend may continue.
1. Rising Three Methods
Bullish continuation pattern.
2. Falling Three Methods
Bearish continuation pattern.
Importance of Volume in Candlestick Trading
Volume confirms candlestick strength.
Example:
- Bullish engulfing with high volume is stronger than low-volume pattern.
Candlestick Patterns and Support/Resistance
Candlestick patterns work best near:
- Support levels
- Resistance levels
Example
Hammer near support:
- Stronger bullish signal
Shooting star near resistance:
- Stronger bearish signal
Candlestick Patterns and Trend
Always analyze patterns with trend direction.
In Uptrend
Bullish continuation patterns work better.
In Downtrend
Bearish continuation patterns work better.
Best Timeframes for Candlestick Analysis
Intraday Trading
- 5-minute
- 15-minute charts
Swing Trading
- 1-hour
- Daily charts
Beginners usually prefer:
- 1-hour or daily charts
Candlestick Psychology
Candlesticks reflect:
- Buyer emotions
- Seller emotions
- Market fear
- Market greed
Understanding psychology improves trading decisions.
Example of Bullish Psychology
Long lower wick indicates:
- Sellers pushed price down
- Buyers regained control
This may signal bullish strength.
Common Candlestick Mistakes Beginners Make
Trading Patterns Without Confirmation
Always wait for:
- Trend confirmation
- Support/resistance confirmation
Ignoring Risk Management
Patterns do not guarantee success.
Using Too Many Patterns
Master a few important patterns first.
Ignoring Market Context
Patterns work differently in different market conditions.
Risk Management in Candlestick Trading
Always use:
- Stop loss
- Position sizing
- Proper risk-reward ratio
Example of Risk-Reward Ratio
Suppose:
- Risk = ₹10
- Target = ₹30
Risk-reward ratio:
1030=3:1
Candlestick Patterns vs Indicators
| Candlestick Patterns | Indicators |
|---|---|
| Based on price action | Based on calculations |
| Faster signals | Sometimes lagging |
| Market psychology focus | Mathematical analysis |
Many traders combine both methods.
Best Candlestick Patterns for Beginners
Beginners often start with:
- Hammer
- Shooting Star
- Bullish Engulfing
- Bearish Engulfing
- Doji
These are simple and widely used.
Candlestick Patterns in Intraday Trading
Intraday traders use candlestick patterns for:
- Quick entries
- Reversal trading
- Breakout trading
Popular intraday patterns:
- Hammer
- Engulfing
- Doji
Candlestick Patterns in Swing Trading
Swing traders use patterns on:
- Daily charts
- 4-hour charts
to identify larger price movements.
Best Stocks for Candlestick Trading
Liquid stocks work best.
Examples:
- Reliance Industries
- Infosys
- HDFC Bank
Can Candlestick Patterns Be Profitable?
Yes, candlestick patterns can improve trading probability when combined with:
- Trend analysis
- Support/resistance
- Risk management
- Trading psychology
However:
- No pattern guarantees profits.
How Beginners Should Learn Candlestick Trading
Step 1: Learn Basic Patterns
Master important patterns first.
Step 2: Practice Chart Reading
Analyze historical charts daily.
Step 3: Use Demo Trading
Practice before using real money.
Step 4: Combine With Risk Management
Protect capital first.
Candlestick patterns are powerful tools for understanding price action and market psychology. They help traders identify trend reversals, continuation patterns, and possible trading opportunities.
For beginners, candlestick analysis is one of the best ways to learn technical analysis and trading behavior. However, successful trading requires more than patterns alone. Traders must also focus on:
- Risk management
- Trend analysis
- Discipline
- Emotional control
With practice and patience, candlestick patterns can become an important part of a trader’s strategy.
Frequently Asked Questions (FAQs)
1. What are candlestick patterns?
Candlestick patterns are chart formations showing price movement and market psychology.
2. Which candlestick pattern is best for beginners?
Hammer and Engulfing patterns are commonly preferred for beginners.
3. What is a Doji candle?
A Doji indicates market indecision.
4. What is a Hammer pattern?
A Hammer is a bullish reversal candlestick pattern.
5. What is a Shooting Star pattern?
A bearish reversal pattern appearing after an uptrend.
6. Do candlestick patterns work in intraday trading?
Yes, many intraday traders use candlestick patterns.
7. Are candlestick patterns accurate?
They improve probability but do not guarantee success.
8. What timeframe is best for candlestick analysis?
1-hour and daily charts are commonly used.
9. Is stop loss important in candlestick trading?
Yes, stop loss is essential for risk management.
10. Can beginners learn candlestick trading?
Yes, with practice and proper learning.