
The Identical Three Crows Pattern is a strong bearish candlestick pattern that often appears after an uptrend and signals a potential market reversal. It is considered one of the most reliable multi-candlestick bearish patterns because it demonstrates consistent selling pressure over multiple trading sessions.
Traders use the Identical Three Crows pattern to identify potential market tops, trend reversals, and short-selling opportunities. When combined with volume analysis, resistance levels, and technical indicators, it can provide high-probability trading setups.
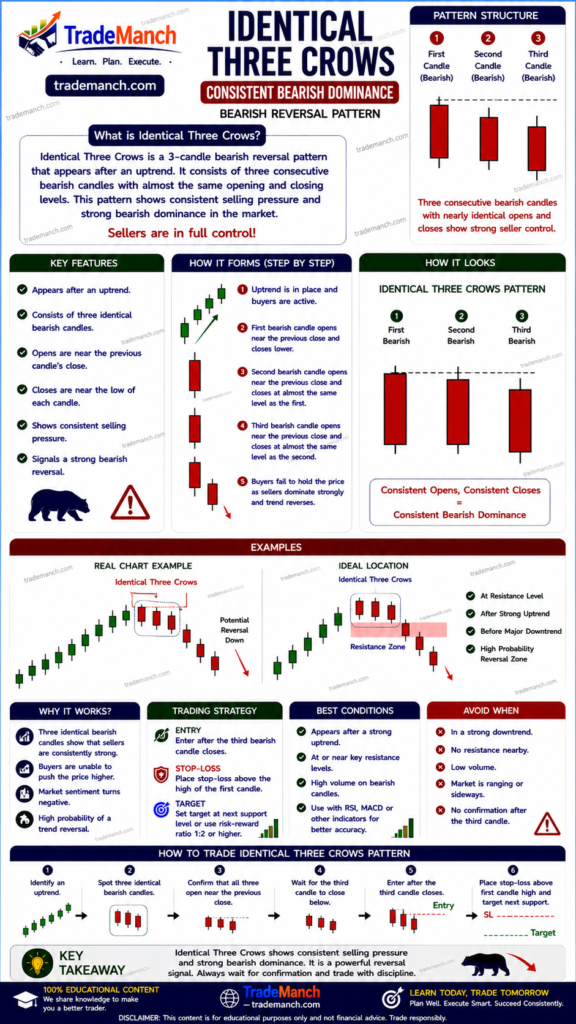
This guide explains the Identical Three Crows Pattern in simple language with practical examples and trading strategies.
What Is the Identical Three Crows Pattern?
The Identical Three Crows is a bearish reversal candlestick pattern consisting of three consecutive bearish candles.
Each candle:
- Opens near the previous candle’s close
- Closes lower than the previous candle
- Has a relatively large body
- Shows strong selling pressure
The pattern usually appears after an uptrend.
Simple Definition of Identical Three Crows Pattern
The Identical Three Crows pattern signals that sellers have gained control of the market and a bullish trend may be reversing.
Why Is It Called “Three Crows”?
The three consecutive bearish candles resemble three black crows sitting one below another.
The pattern visually represents growing bearish sentiment.
Structure of the Identical Three Crows Pattern
The pattern consists of:
First Bearish Candle
Shows the first sign of seller strength.
Second Bearish Candle
Opens near the previous close and continues downward.
Third Bearish Candle
Repeats the same behavior and confirms strong bearish momentum.
Characteristics of the Pattern
| Feature | Description |
|---|---|
| Pattern Type | Bearish Reversal |
| Number of Candles | Three |
| Trend Requirement | Uptrend |
| Signal Strength | Strong |
| Reliability | High with Confirmation |
| Volume | Preferably Increasing |
Market Psychology Behind the Pattern
Understanding the psychology helps explain why the pattern is powerful.
Stage 1: Strong Uptrend
Buyers control the market.
Optimism is high.
Stage 2: First Crow Appears
Selling pressure emerges.
Some traders start booking profits.
Stage 3: Second Crow Forms
Sellers continue pushing prices lower.
Buyer confidence weakens.
Stage 4: Third Crow Appears
Selling pressure accelerates.
The market begins accepting lower prices.
Result
The bullish trend weakens significantly and a bearish reversal becomes more likely.
Conditions for a Valid Identical Three Crows Pattern
Existing Uptrend
The pattern is most effective after a sustained uptrend.
Three Consecutive Bearish Candles
Each candle closes lower than the previous one.
Similar Candle Size
The candles should have relatively similar bodies.
Small or No Upper Shadows
Shows sellers maintained control throughout the session.
Strong Closing Prices
Each candle closes near its low.
How to Identify the Pattern
Step 1
Identify a strong uptrend.
Step 2
Look for three consecutive bearish candles.
Step 3
Ensure each candle opens near the previous close.
Step 4
Confirm that each candle closes lower than the previous candle.
Step 5
Analyze volume and market context.
Importance of Volume
Volume significantly increases pattern reliability.
Increasing Volume
Indicates strong selling participation.
High Volume on Third Crow
Provides stronger bearish confirmation.
Low Volume
May reduce reliability.
Trading Strategy Using Identical Three Crows
Step 1
Identify the completed pattern.
Step 2
Wait for confirmation.
Step 3
Enter after the third candle or on a pullback.
Step 4
Place stop-loss above recent highs.
Step 5
Set profit targets using support levels.
Entry Strategy
Aggressive Entry
Enter immediately after the third candle closes.
Conservative Entry
Wait for a pullback toward resistance.
Stop-Loss Placement
Proper risk management is essential.
Common Stop-Loss Level
Above the high of the first crow.
Alternative Method
Above the pattern high.
Profit Target Methods
Previous Support Levels
Common target zones.
Risk-Reward Ratio
Aim for at least:
1:2
or better.
Trailing Stop-Loss
Protect profits during strong declines.
Example of Identical Three Crows
Suppose a stock rises from:
₹800 to ₹1,000
Then forms:
First Crow
₹1,000 → ₹970
Second Crow
₹970 → ₹940
Third Crow
₹940 → ₹900
This sequence suggests strong bearish momentum and a possible trend reversal.
Identical Three Crows vs Three Black Crows
Many traders use these terms interchangeably.
However:
Three Black Crows
General pattern with three bearish candles.
Identical Three Crows
A stricter version where each candle opens at or very close to the previous candle’s close.
Identical Three Crows vs Bearish Engulfing
| Feature | Identical Three Crows | Bearish Engulfing |
|---|---|---|
| Candles | Three | Two |
| Signal Strength | Strong | Moderate to Strong |
| Confirmation | Built Into Pattern | Often Requires Additional Confirmation |
| Reliability | High | High |
Best Indicators to Use with Identical Three Crows
RSI (Relative Strength Index)
Look for:
RSI Above 70
May indicate overbought conditions.
MACD
Bearish crossover strengthens the signal.
Moving Averages
Confirm trend reversal.
Volume Analysis
Validates seller participation.
Advantages of Identical Three Crows Pattern
Strong Bearish Signal
Represents sustained selling pressure.
Easy to Recognize
Clear visual structure.
Works Across Markets
Stocks, forex, commodities, and cryptocurrencies.
Useful for Reversal Trading
Helps identify potential market tops.
Limitations of Identical Three Crows Pattern
Can Appear During Corrections
Not every occurrence leads to a major reversal.
Requires Context
Works best after an uptrend.
False Signals Possible
Confirmation is still important.
Common Beginner Mistakes
Ignoring Trend Context
The pattern should appear after an uptrend.
Trading Without Confirmation
Additional signals improve accuracy.
Ignoring Volume
Volume helps validate the pattern.
No Stop-Loss
Risk management remains essential.
Best Time Frames for Trading
Intraday Trading
15-minute and 30-minute charts.
Swing Trading
Daily charts.
Positional Trading
Weekly charts.
Practical Example
Suppose:
A stock rallies from ₹500 to ₹700.
Near resistance:
Three consecutive bearish candles form.
Possible Trade Setup:
Entry
After third candle confirmation.
Stop-Loss
Above recent high.
Target
Nearest support level.
How Reliable Is the Identical Three Crows Pattern?
The pattern is considered one of the strongest bearish reversal signals because:
- Selling pressure is sustained over three sessions.
- Market sentiment changes visibly.
- Buyer strength weakens progressively.
However, no pattern guarantees success.
Best Combination for Beginners
Use:
Identical Three Crows Pattern
Resistance Levels
RSI
Volume Analysis
for stronger bearish setups.
The Identical Three Crows Pattern is a powerful bearish reversal signal that indicates growing seller dominance and weakening buyer momentum. Its three consecutive bearish candles reflect a significant shift in market sentiment and often precede downward price movements.
When combined with resistance levels, volume confirmation, RSI, MACD, and proper risk management, the Identical Three Crows pattern can help traders identify high-probability bearish trading opportunities.
Remember: always wait for confirmation and follow disciplined risk management practices.
Frequently Asked Questions (FAQs)
1. What is the Identical Three Crows Pattern?
The Identical Three Crows is a bearish reversal candlestick pattern consisting of three consecutive bearish candles.
2. Why is the pattern considered bearish?
It shows sustained selling pressure and weakening buyer strength.
3. Where does the pattern work best?
After a strong uptrend and near major resistance levels.
4. How many candles form the pattern?
Three consecutive bearish candles.
5. What is the difference between Three Black Crows and Identical Three Crows?
Identical Three Crows is a stricter version where each candle opens near the previous candle’s close.
6. Does volume matter?
Yes. Increasing volume strengthens the bearish signal.
7. What is the ideal stop-loss?
Above the pattern high or the first crow’s high.
8. Which indicators work best with the pattern?
RSI, MACD, Moving Averages, Support & Resistance, and Volume Analysis.
9. Can the pattern fail?
Yes. No candlestick pattern is 100% accurate.
10. Is the Identical Three Crows pattern suitable for beginners?
Yes. It is a visually clear and reliable bearish reversal pattern that beginners can learn easily.