🔍 What is the Tasuki Gap Pattern?
The Tasuki Gap is a trend continuation candlestick pattern that appears during a strong uptrend or downtrend. It uses a price gap as support or resistance, signaling that the current trend is likely to continue.
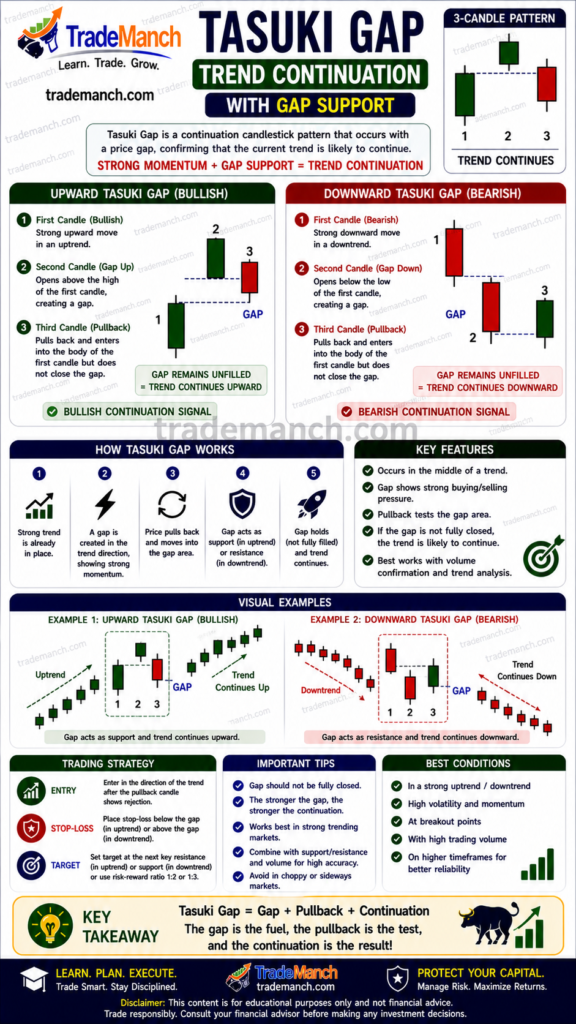
👉 The gap area acts as a key momentum zone where buyers or sellers defend the trend direction.
🟢 Bullish Tasuki Gap
📈 Structure
- 🟢 Strong bullish candle
- 🟢 Another bullish candle with a gap up
- 🔴 Small bearish candle partially fills the gap but does not close it completely
👉 Signals buyers are still dominant and the uptrend may continue.
🔴 Bearish Tasuki Gap
📉 Structure
- 🔴 Strong bearish candle
- 🔴 Another bearish candle with a gap down
- 🟢 Small bullish candle partially fills the gap but does not close it completely
👉 Signals sellers remain dominant and the downtrend may continue.
💡 Psychology Behind the Pattern
The Tasuki Gap reflects temporary profit booking within a strong trend:
- Strong momentum creates a gap
- Opposite-side traders attempt a pullback
- The gap remains partially open, showing trend strength
👉 This confirms that the original trend still has strong momentum.
✅ How to Trade the Tasuki Gap
🔹 Step-by-Step Strategy:
- Identify Strong Existing Trend
Pattern works best in trending markets. - Spot the Gap Formation
Look for a clear upward or downward gap. - Check Gap Support/Resistance
The third candle should not fully close the gap. - Entry Point
- Buy above bullish setup high
- Sell below bearish setup low
- Stop Loss
Place beyond the opposite side of the gap. - Target
Use trend continuation targets or support/resistance levels.
⚠️ Common Mistakes to Avoid
- ❌ Trading in sideways markets
- ❌ Ignoring the gap condition
- ❌ Third candle fully closing the gap
- ❌ Weak trend momentum
🔗 Tasuki Gap vs Side by Side White Lines
| Pattern | Key Feature | Signal |
|---|---|---|
| Tasuki Gap | Partial gap fill attempt | Continuation |
| Side by Side White Lines | Similar bullish candles after gap | Continuation |
👉 Tasuki Gap specifically focuses on the market defending an unfilled gap.
🚀 Pro Tips for Better Accuracy
- Combine with moving averages & trendlines
- Use volume confirmation
- Watch for breakaway gaps
- Trade with higher timeframe trend direction
The Tasuki Gap pattern is a strong continuation signal showing that buyers or sellers are defending the gap area and maintaining trend momentum.
👉 When the gap remains partially unfilled, it often indicates the trend still has strength to continue.